When we talk about trading and financial market analysis, our minds often conjure images of technical charts with candles, lines, and tons of numbers. In fact, prices constantly fluctuate, discussions revolve around all-time highs, candlestick patterns, and indicators. Initially overwhelming, there are highly useful tools that bring order and understanding to the chaos of numbers and charts—technical indicators in trading .
Moreover, these indicators are crucial tools for most traders to find entry points into their trades. Besides that, they assess price trends, and identify overbought and highly volatile phases of assets. In this article, we present the 5 most popular technical indicators!
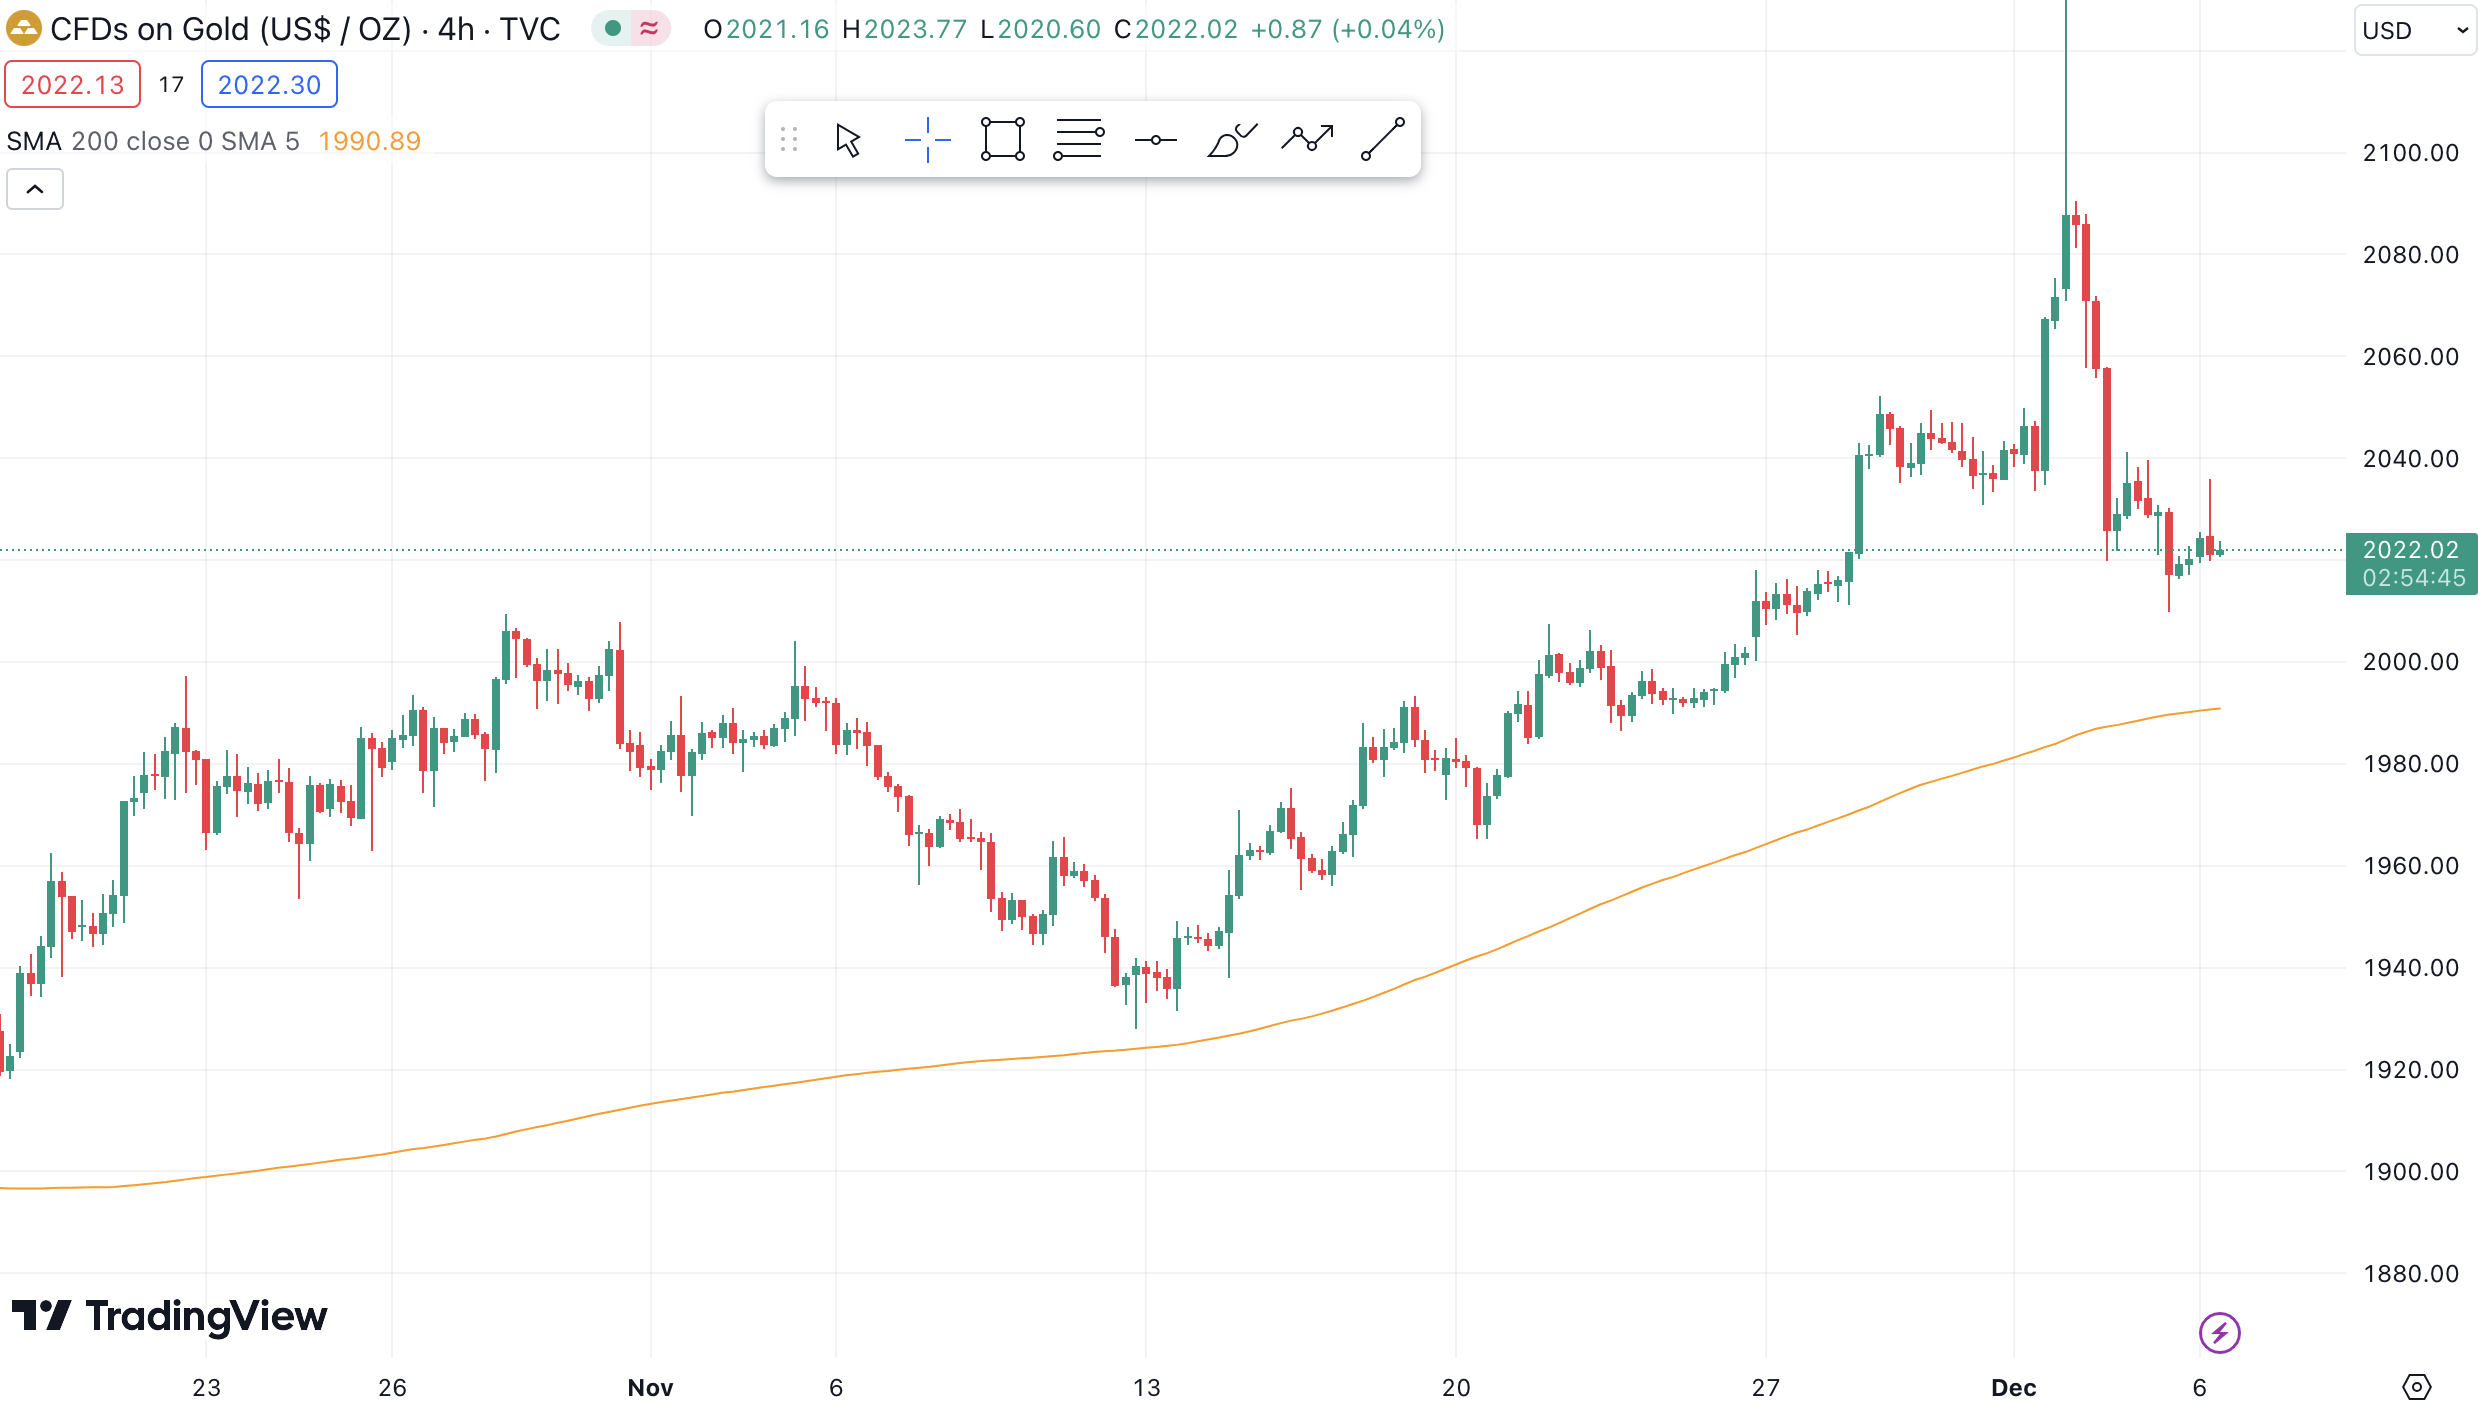
Moving Averages (MA)
Moving Averages are depicted as a simple line on charts, essentially considering the average price of the last candles over a specific period. What does this bring us in trading? These MAs smooth out the price level and, depending on the period, indicate longer-term trends or can be used as a crossover strategy. By combining two MAs, if the MAs cross, it may indicate a trend reversal. MAs are often used as support and resistance zones. In particular, when the price hits longer-term MAs, it often bounces off, providing a potentially good entry point for a trade.
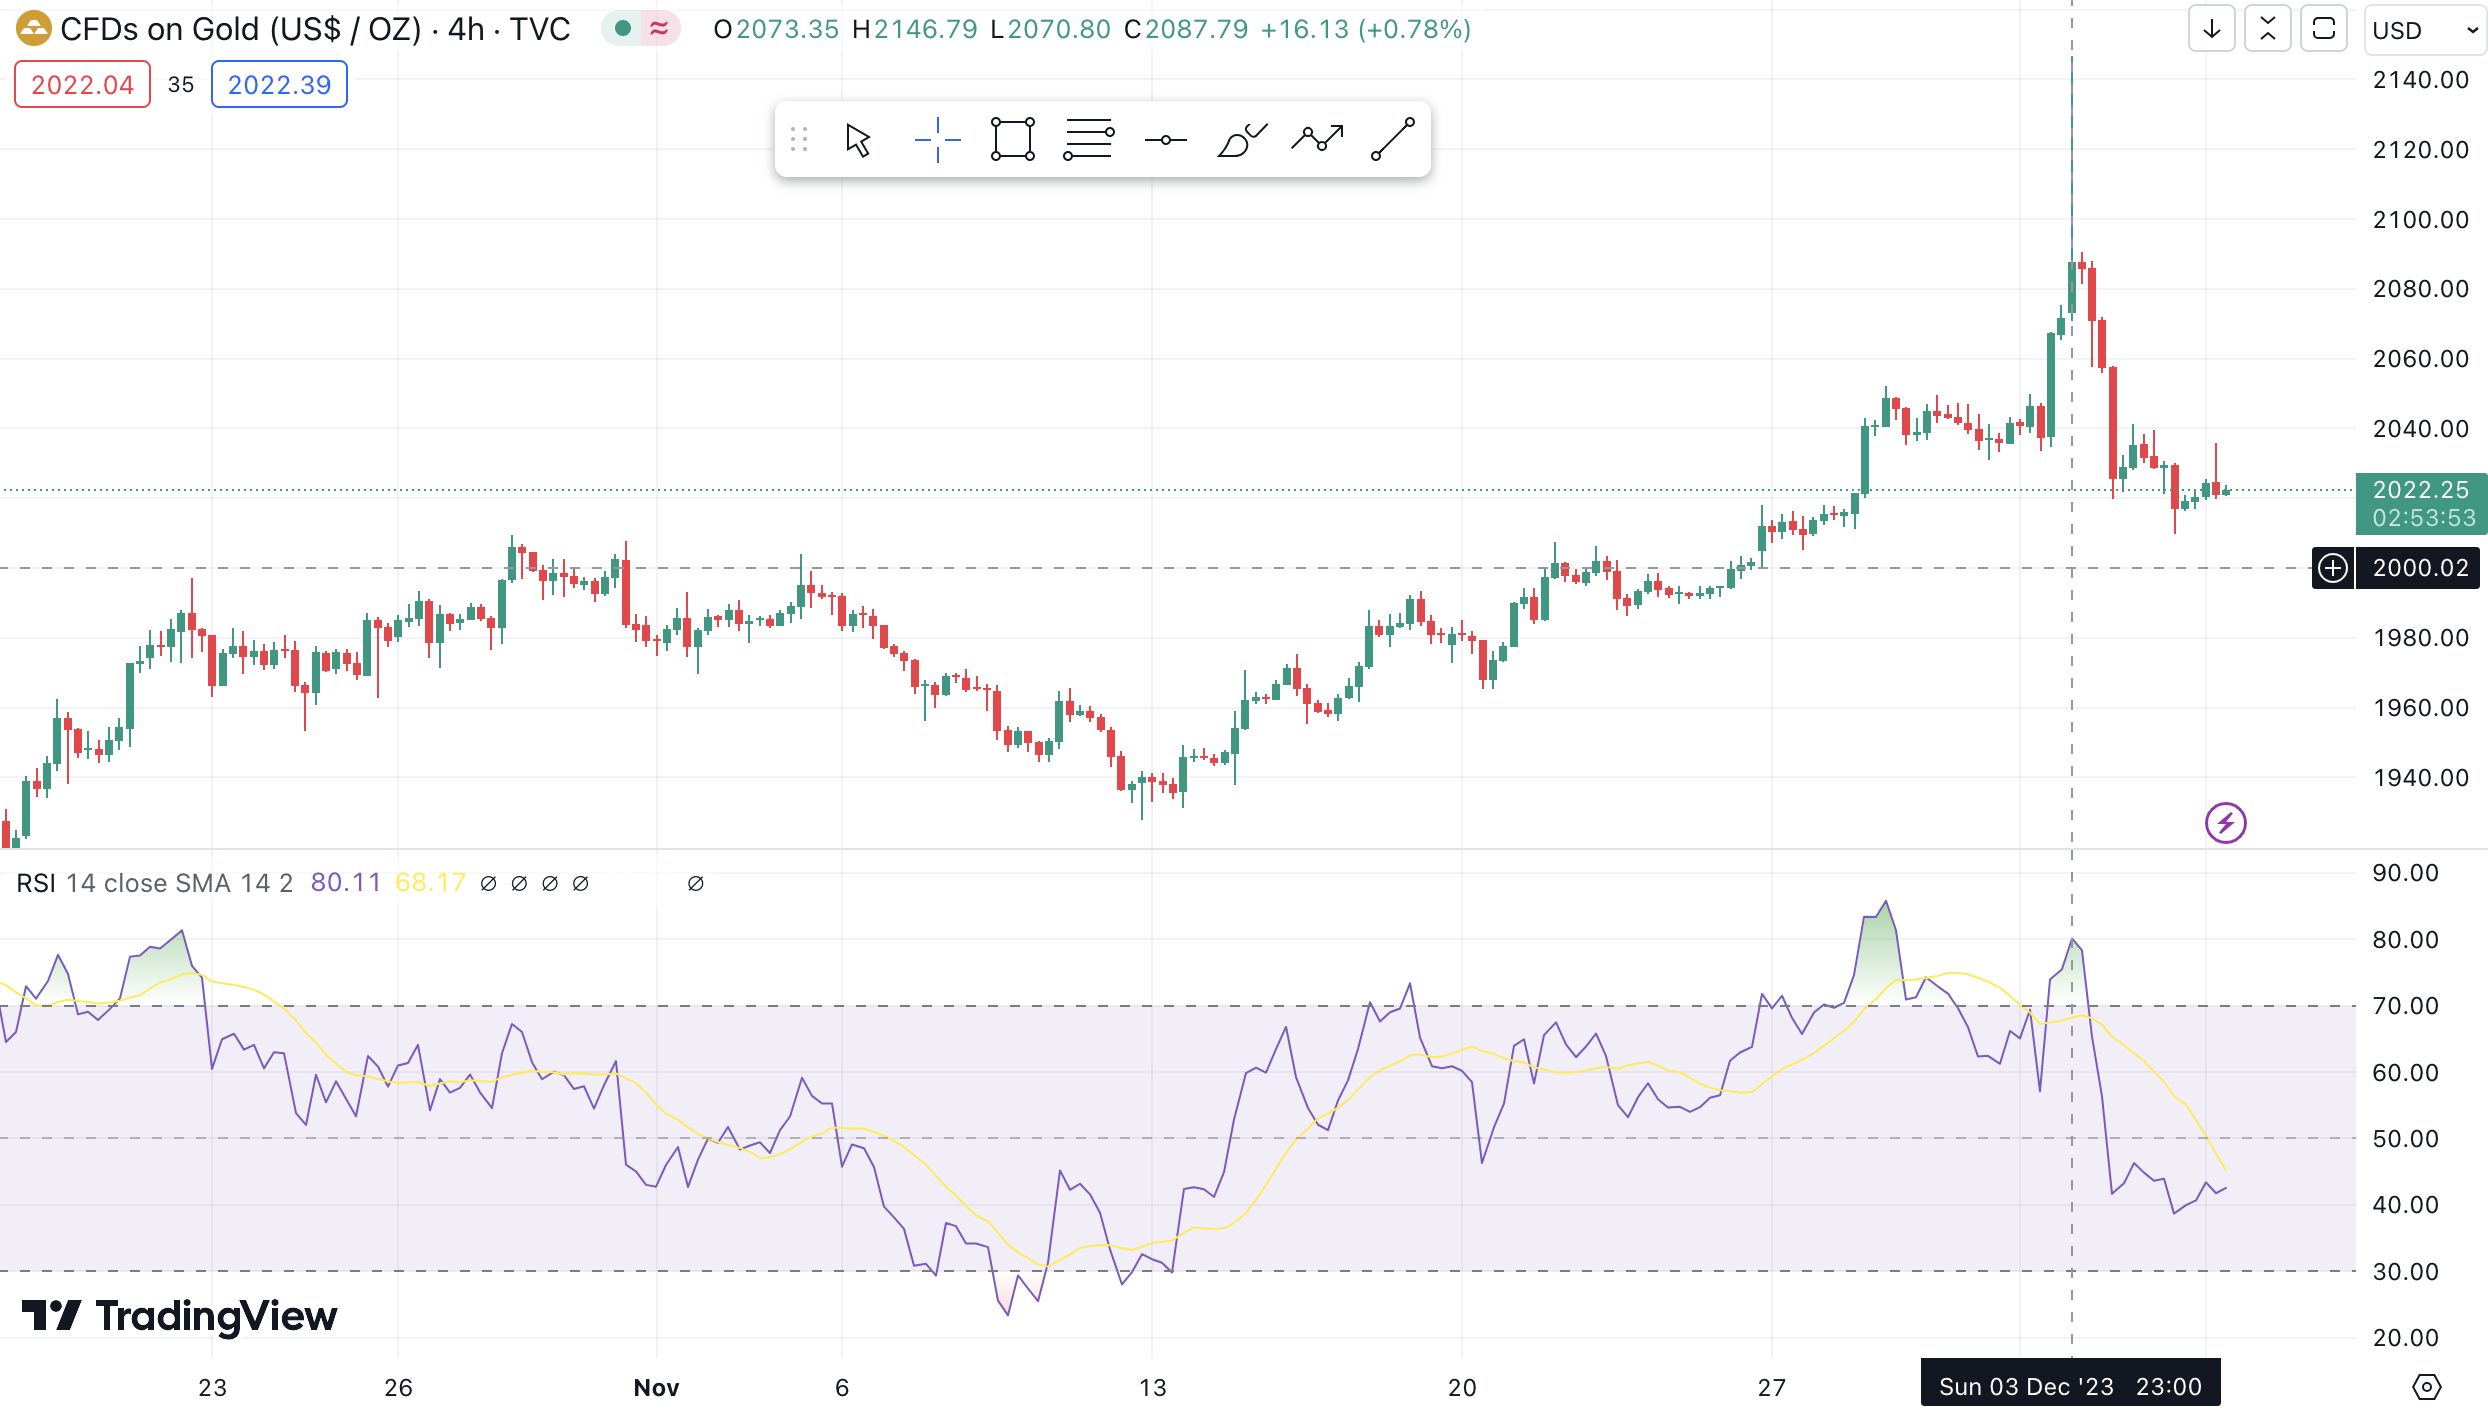
Relative Strength Index (RSI)
The RSI is a momentum oscillator measuring the speed and change of price movements. Ranging from 0 to 100, it is typically used to identify overbought or oversold conditions in a market. A value above 70 indicates an overbought condition, while a value below 30 indicates an oversold condition. Using the RSI, traders can assess whether entering a trade makes sense during a given market period. This is mainly because prices often move into overvalued zones due to various fundamental factors.
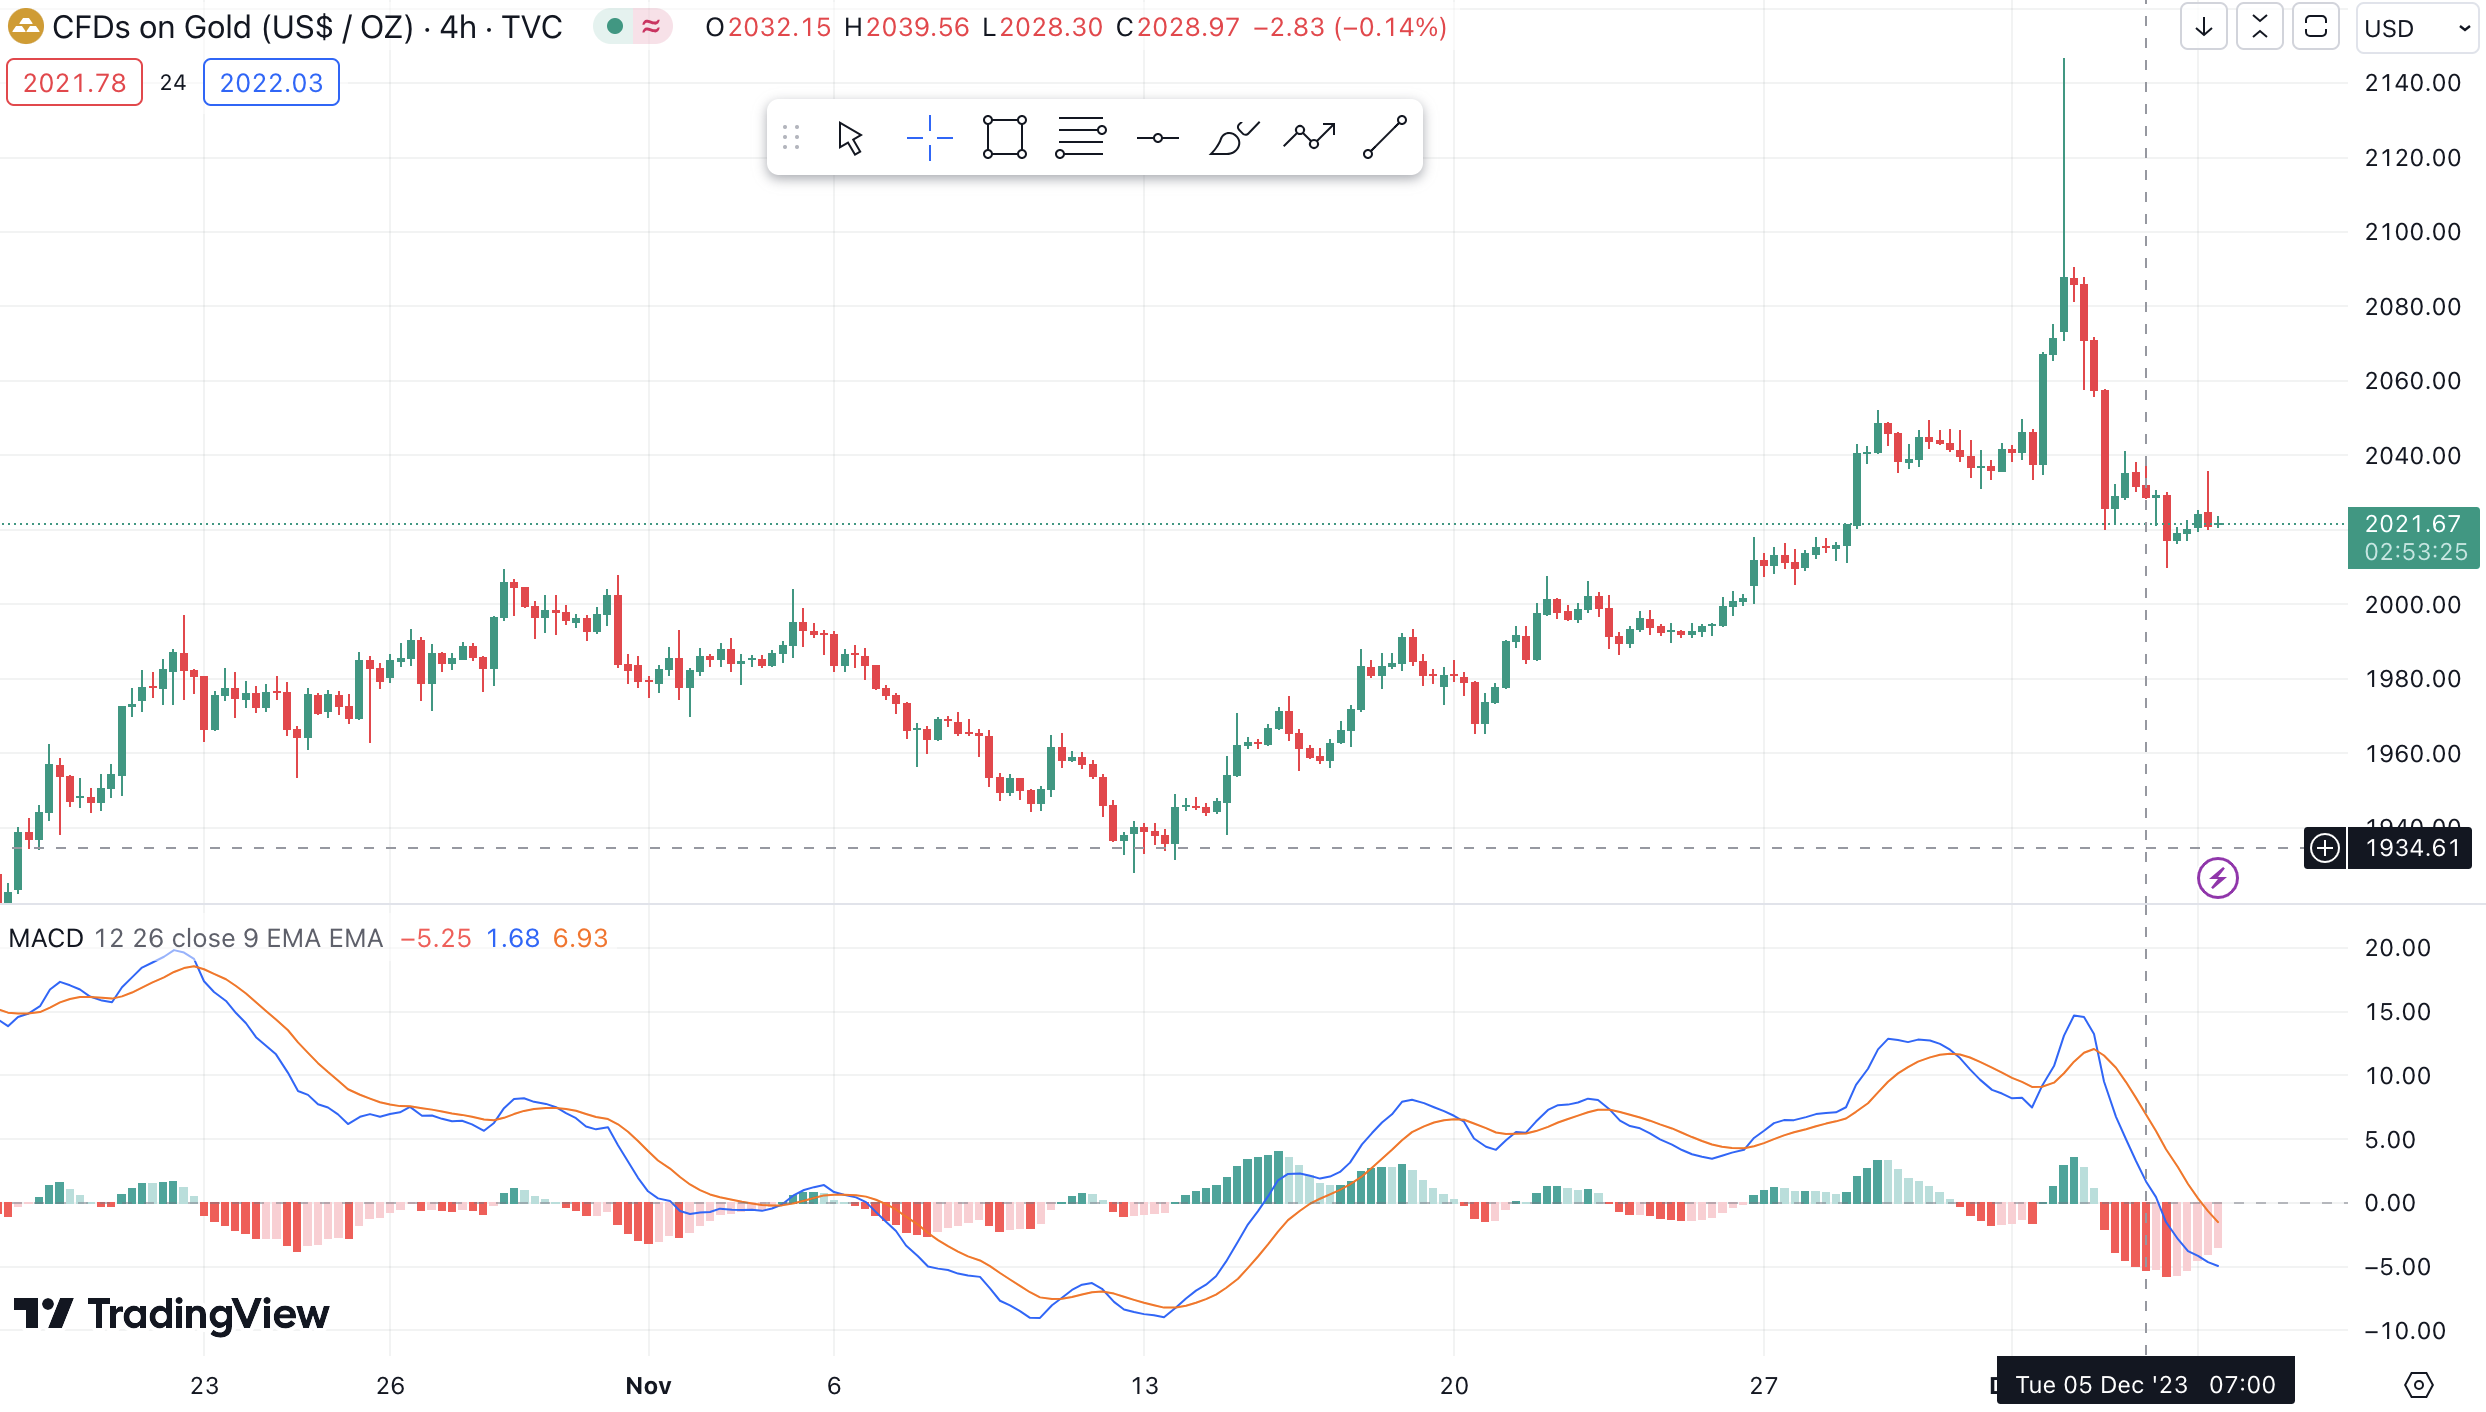
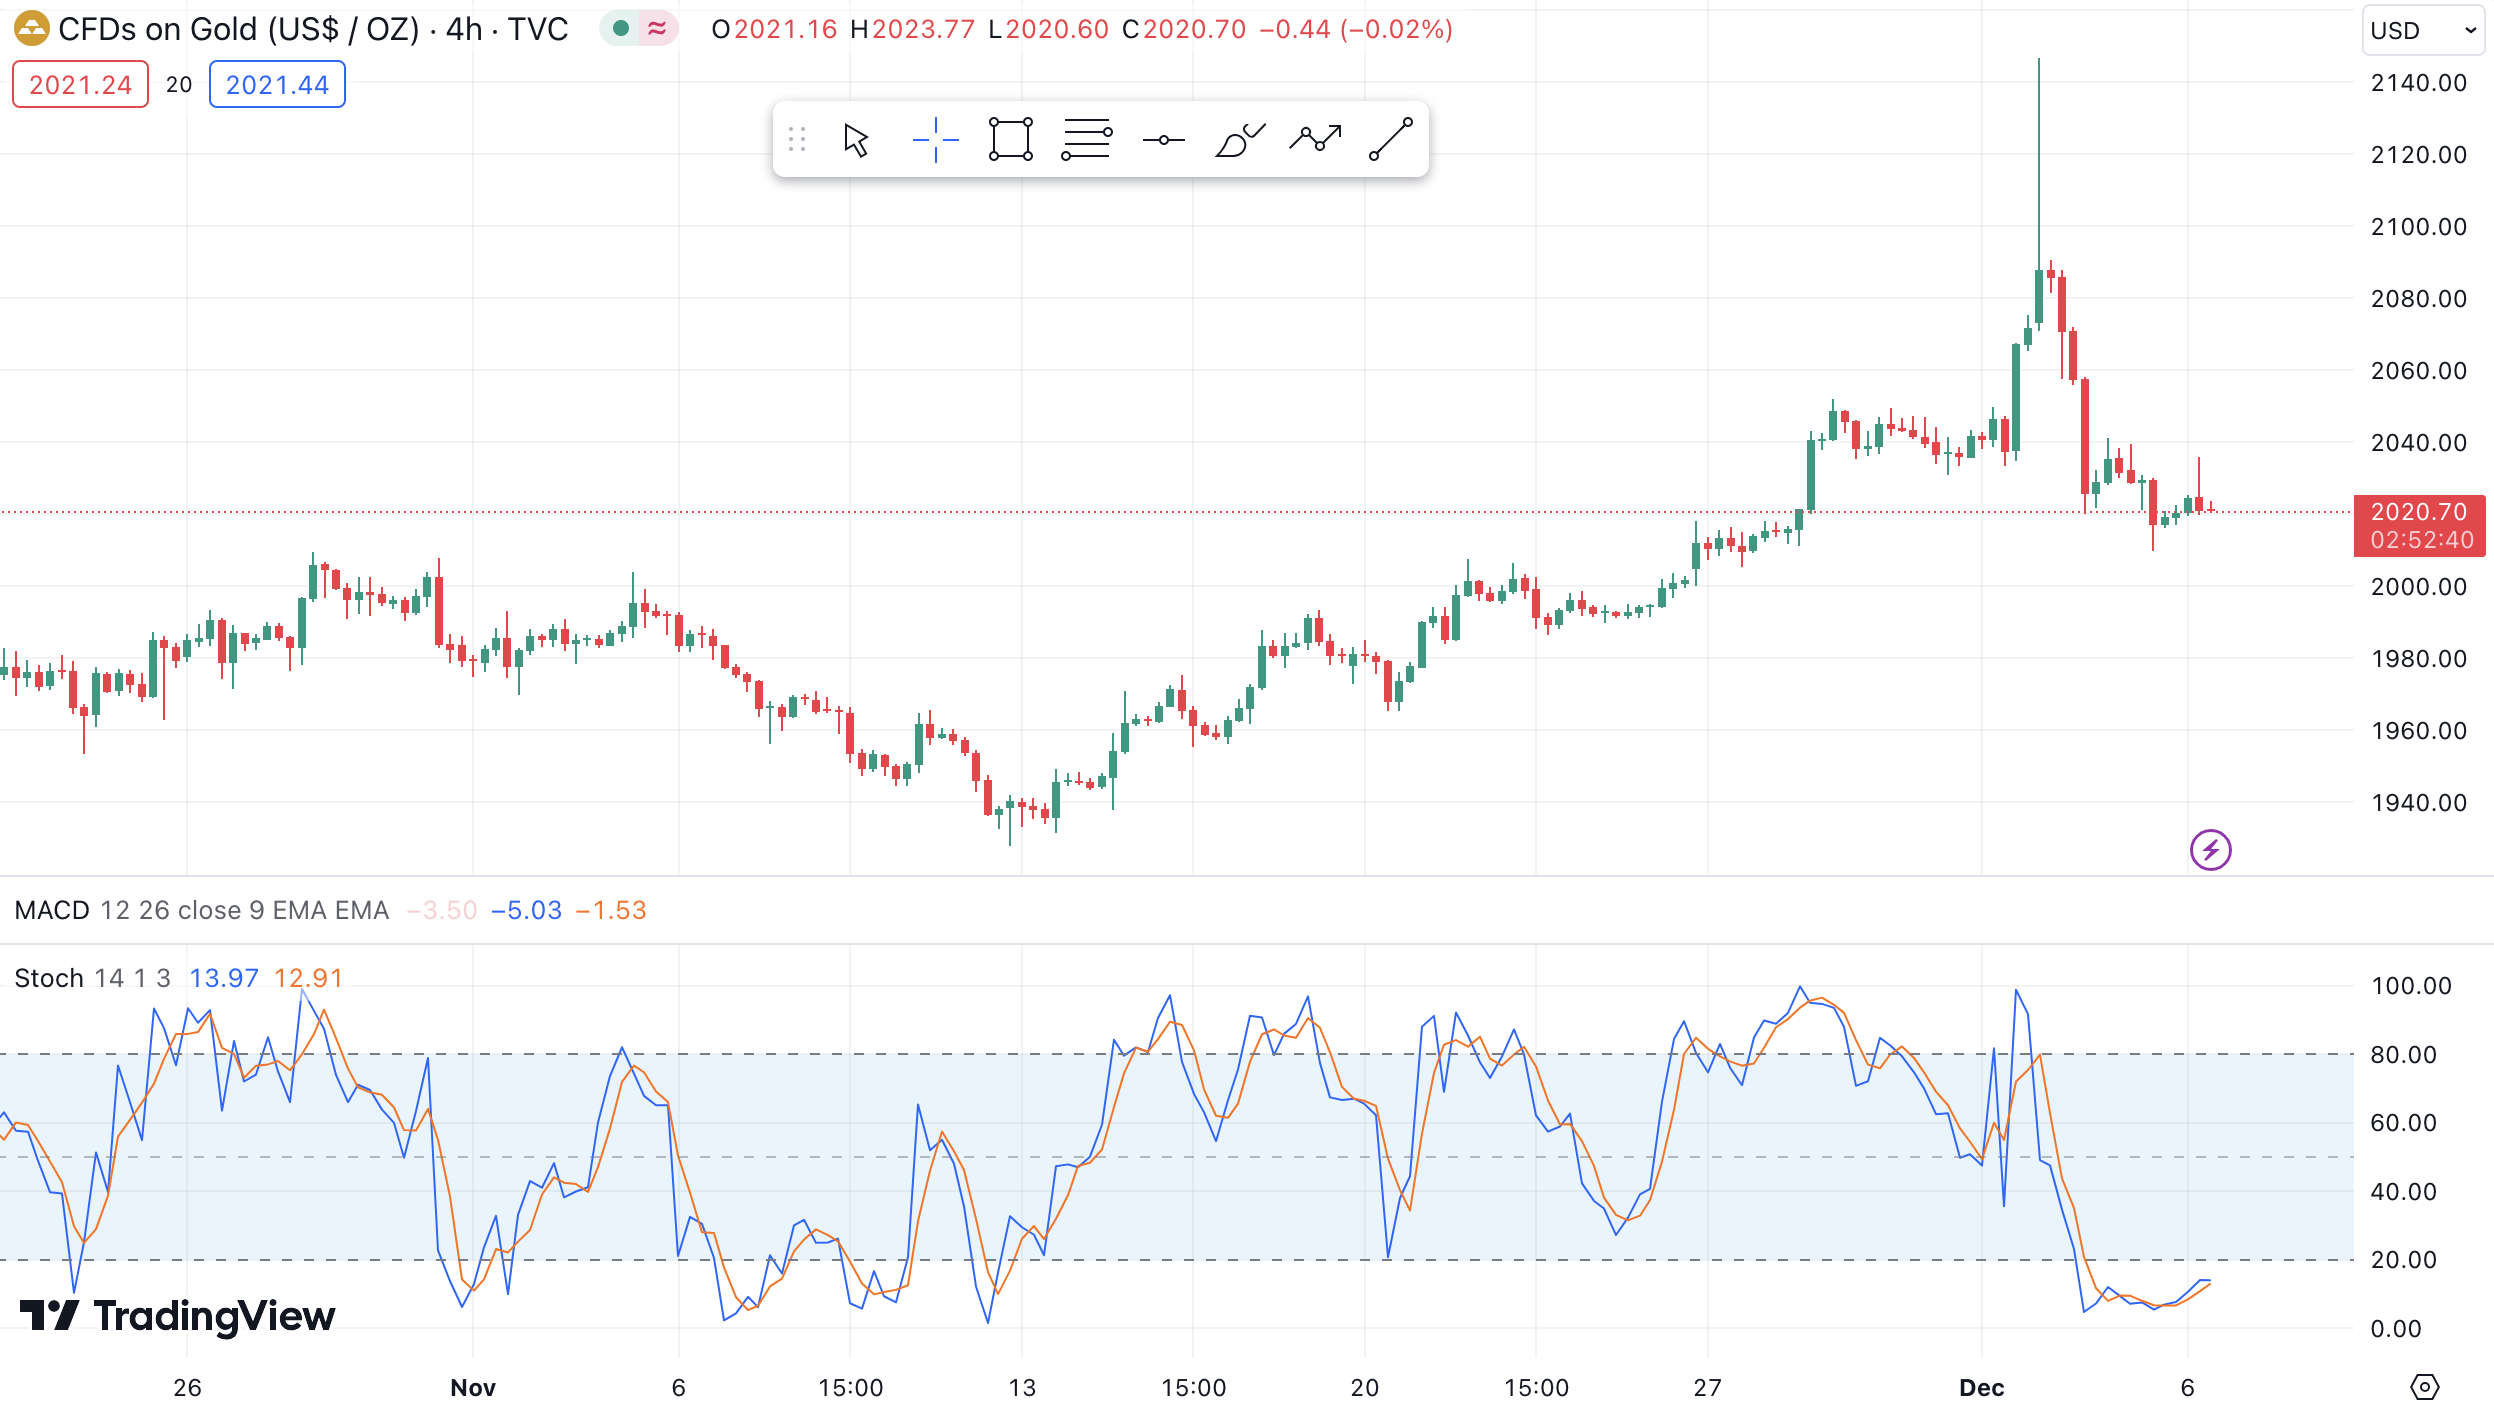
Moving Average Convergence Divergence (MACD)
The MACD is a momentum indicator in trading that compares two moving averages (MA). In particular, it displays the difference between them as a line (MACD line) and the MA of this difference as a signal line. For example, traders use the MACD to identify trend strength, potential trend reversal points, and trading signals. A positive MACD indicates that the short-term MA is above the long-term. This way, it shows an uptrend, and vice versa. Therefore, crossovers between the MACD and signal line generate buy or sell signals providing insights into trend development. What’s more this enables timely trading decisions.
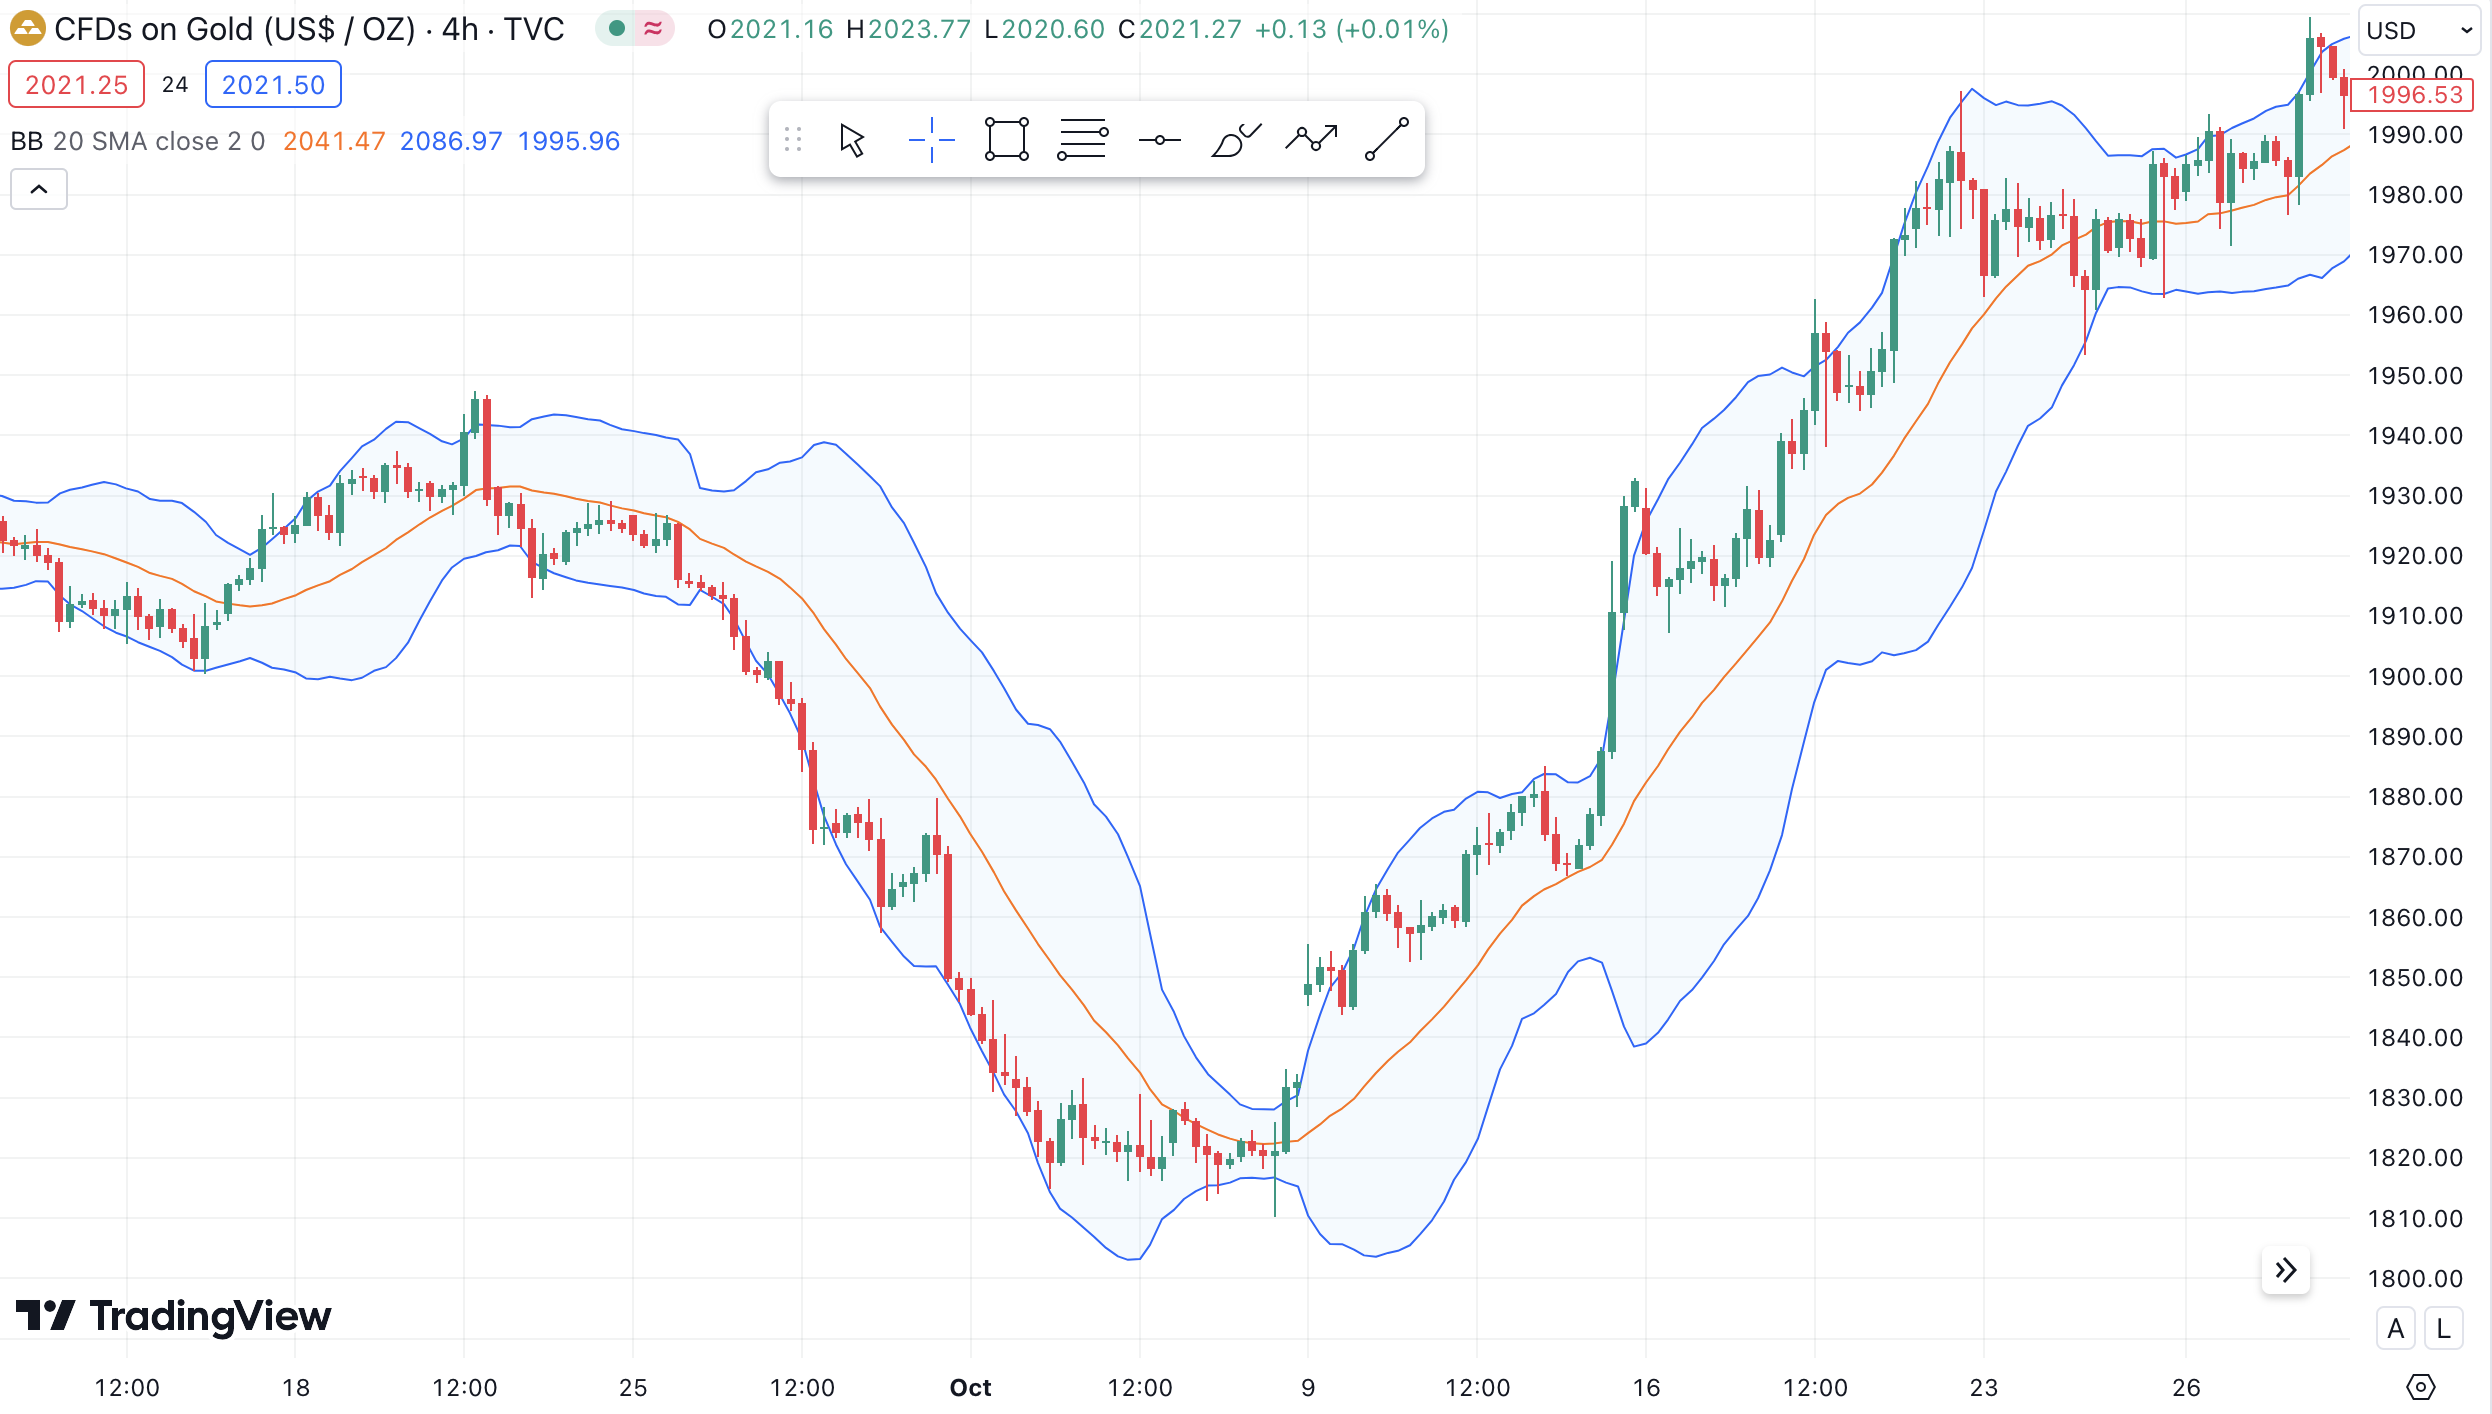
Bollinger Bands
Bollinger Bands are a technical indicator consisting of three lines: a moving average in the middle and two standard deviations above and below. These bands measure the volatility of an asset. Prices near the upper band suggest overbought conditions, while prices near the lower band suggest oversold conditions. Actually, traders use Bollinger Bands to identify potential trend reversal points, volatility spikes, and trading opportunities. A narrow distance between the bands indicates low volatility, while a wider gap suggests high volatility.
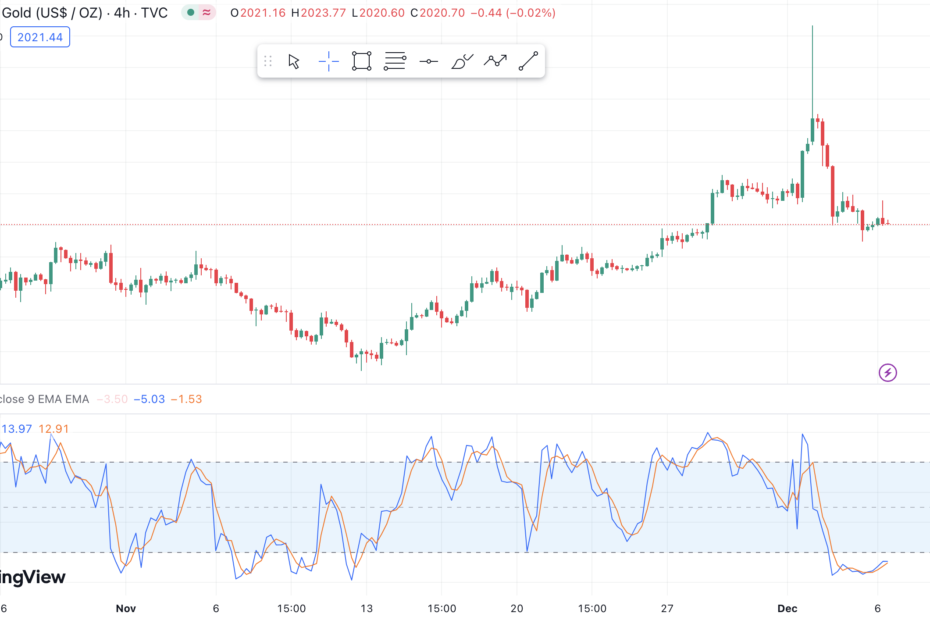
Stochastic Oscillator
The Stochastic Oscillator can be understood and used similarly to the RSI. It is also a momentum indicator in trading, measuring the position of a closing price relative to the range from high to low over a specific period.
More specifically, it consists of two lines, %K and %D. Values above 80 show overbought conditions, while values below 20 show oversold cases. Traders use the Stochastic Oscillator to identify potential trend reversal points. Crossovers between %K and %D, as well as divergences between the price and the oscillator, can serve as trading signals. As a result, they allow recognition of overbought or oversold conditions and make appropriate trading decisions.
Always be careful with Technical Indicators
We’ve explored some of the most well-known trading indicators. However, the key to using these indicators lies in the combination and personal trading strategy. Trading decisions should never be based solely on individual technical indicators. This means that it’s crucial to gather as much information as possible for a specific asset. Then, you can use technical indicators to identify precise entry points or trend directions.
Bear in mind that not every signal is flawless and can be adopted for a trade without reservations. Certain indicators may work better in different areas. Therefore, they might emphasize the importance of incorporating indicators as additional tools into one’s personal trading strategy.