One of the most iconic chart patterns in technical analysis is the Head and Shoulders.
It is a bearish reversal pattern that originates after an uptrend, indicating that the main movement is running out, and that the price is about to change direction.
With just a little practice, this pattern can be easily spotted on a chart: if you see three consecutive peaks, with the central one being higher, there’s a high probability that you’ve found one!
The aim of this article is to provide a comprehensive guide to identifying this figure, investigating the logic that makes it effective, and how to manage entry and exit from a position based on this setup.
Let’s get started!
The Anatomy
The Head and Shoulders pattern consists of two lower peaks, which form the shoulders, and a higher central one, the head.
With the left shoulder, the market forms a high, followed by a brief retracement. The price then rises again, significantly exceeding the level of the left shoulder, and then declines. At this point, a third rally fails to reach the height of the head, stopping approximately at the same level as the left shoulder, thus starting a new decline.
The line that connects the two lows is called the neckline, and represents a key level: a break below it confirms the setup and activates the reversal signal.

Psychology Behind the Pattern
The H&S pattern is considered one of the most reliable in technical analysis, and understanding the psychologybehind its formation can help explain why.
The price is in an uptrend, forming higher highs and higher lows. Bulls are winning against bears. Driven by general optimism, positive news, or strong bullish momentum, the price breaks above the previous high after a retracement, attracting even more buyers and forming a new peak, the head.
At this point, a sense of caution may spread among seasoned investors, who begin to doubt the sustainability of the trend. Some retail traders might enter long, a little too late. A new retracement begins.
The price then tries to break the previous high, but it fails. Experienced traders notice the loss of momentum. Sellers begin to overpower the buyers. If the price breaks below the neckline, investors take this as confirmation of the reversal of the trend, and selling pressure intensifies, leading the price to decrease.
This psychological progression is the reason why the pattern is so reliable. It simply is a reflection of collective behavior. From enthusiasm, to indecision, to surrender. A progressive failure from the buyers’ side to sustain new highs.
Entry and Exit Strategies
And now, the cool part. How to trade the Head and Shoulders pattern.
There are three potential entry points to consider, depending on the kind of trader you are.
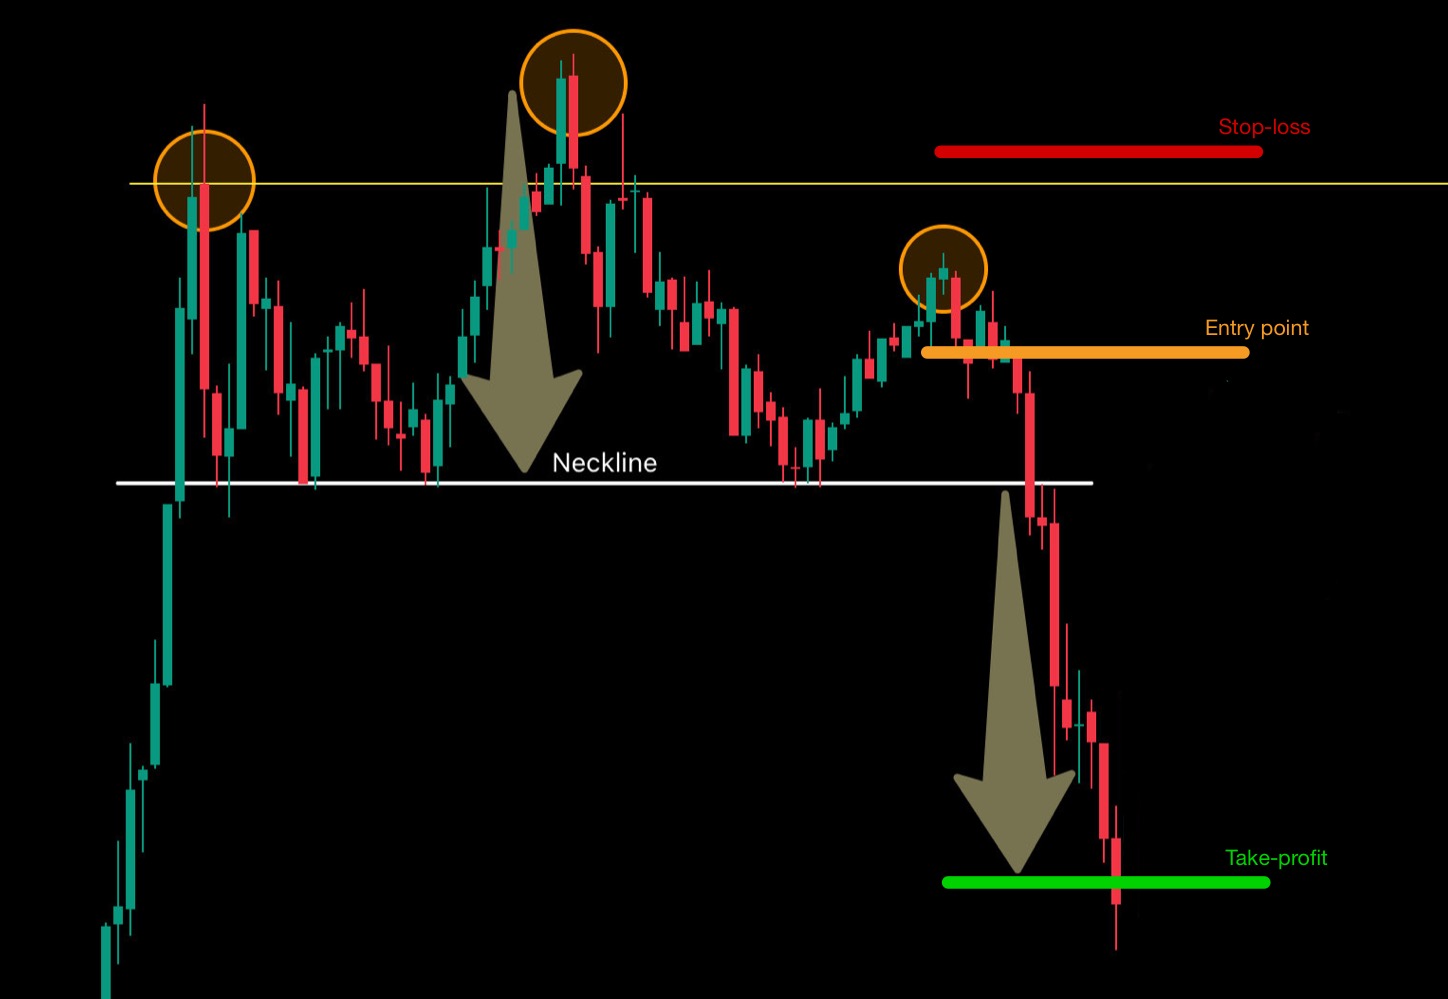
If you prefer an aggressive approach, with a higher potential risk-reward ratio, consider entering before the break of the neckline, right after the formation of the right shoulder. The stop-loss will be placed right above the high represented by the left shoulder, or above the head. As in the picture below.
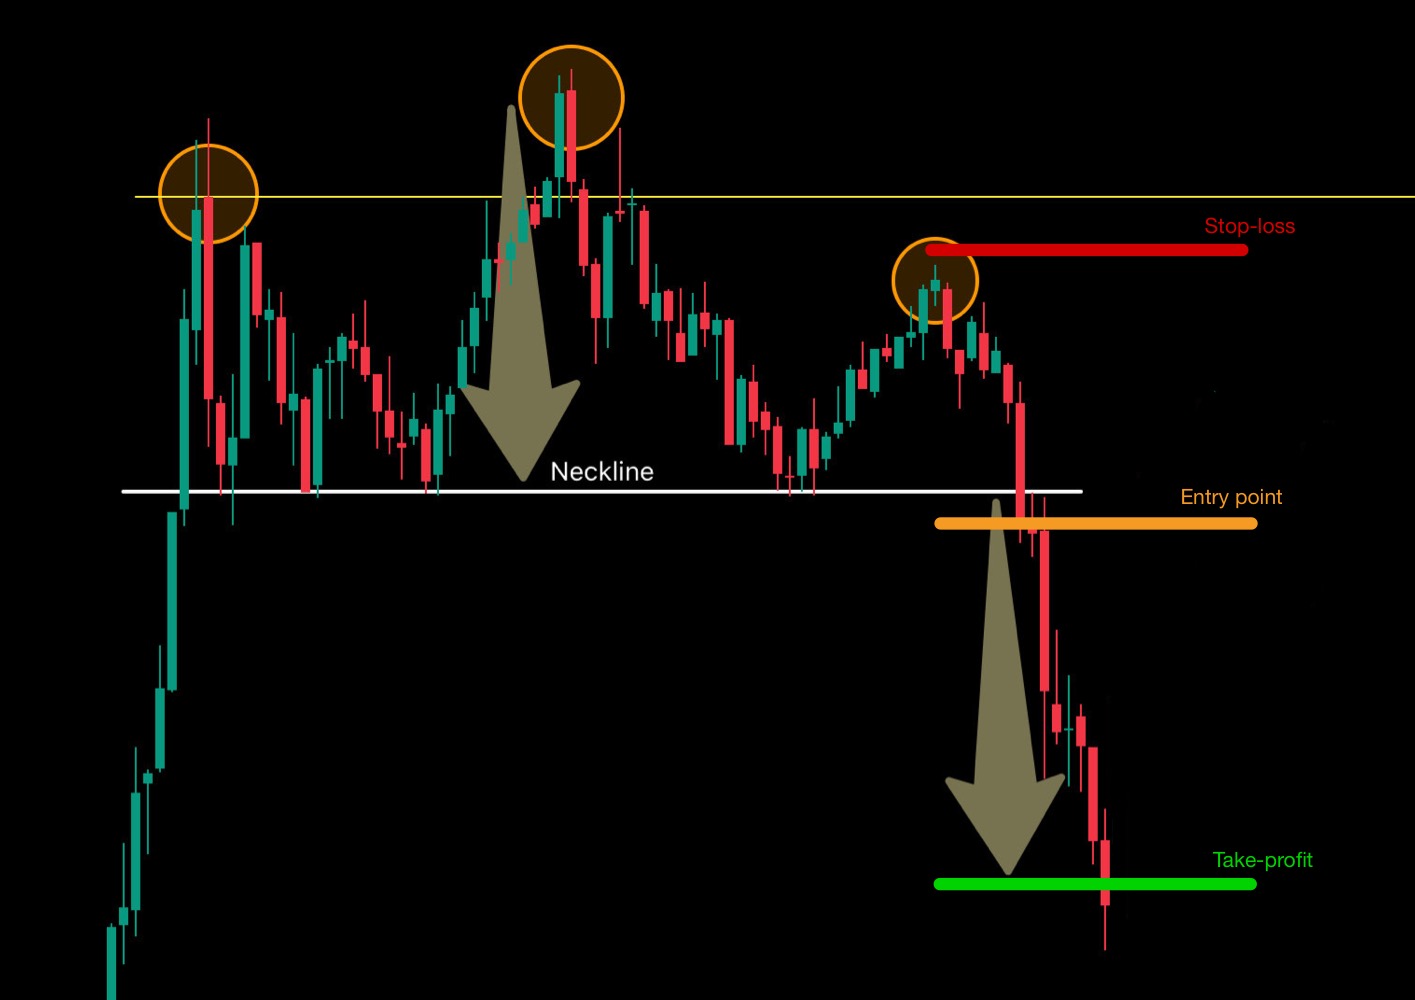
This setup comes with risk: the price may not continue downward. For a more conservative entry, wait for a candle to close below the neckline. That’s your signal to enter. The stop-loss right above the high of the right shoulder.
If you prefer an even more secure approach, consider entering after the neckline is retested, once the price has broken it. In this case, the stop-loss might be placed above the right shoulderor above the new high created during the retest.
As for the take profit, a common target is the level where the distance from the neckline to the target equals the distance from the head to the neckline.
This target zone generally remains the same regardless of the entry strategy.
Another method is to use support areas as potential profit-taking zones.
Inverse Head and Shoulders
The Inverse Head and Shoulders is the bullish counterpart of the traditional Head and Shoulders pattern. It forms after a downtrend and signals a potential reversal to the upside.
Like the standard version, it reflects a shift in sentiment, from pessimism to hesitation to renewed optimism.
Structure:
- Left shoulder: The price drops to a new low, then retraces upward.
- Head: A deeper low is formed, followed by another retracement.
- Right shoulder: A higher low forms, indicating weakening selling pressure.
- Neckline: The resistance level connecting the peaks of the retracements.
When the neckline is broken to the upside, it confirms the pattern and often triggers a bullish move.
Entry and exit strategies mirror those of the standard pattern. Traders may choose to enter aggressively during the right shoulder, or more conservatively after the breakout or its retest.
Common Mistakes
Despite its reliability, the pattern may generate false signals if interpreted incorrectly.
One common mistake is misidentifying the pattern, confusing regular price fluctuations with actual shoulder-head-shoulder structures. A bit of practice can help avoid this.
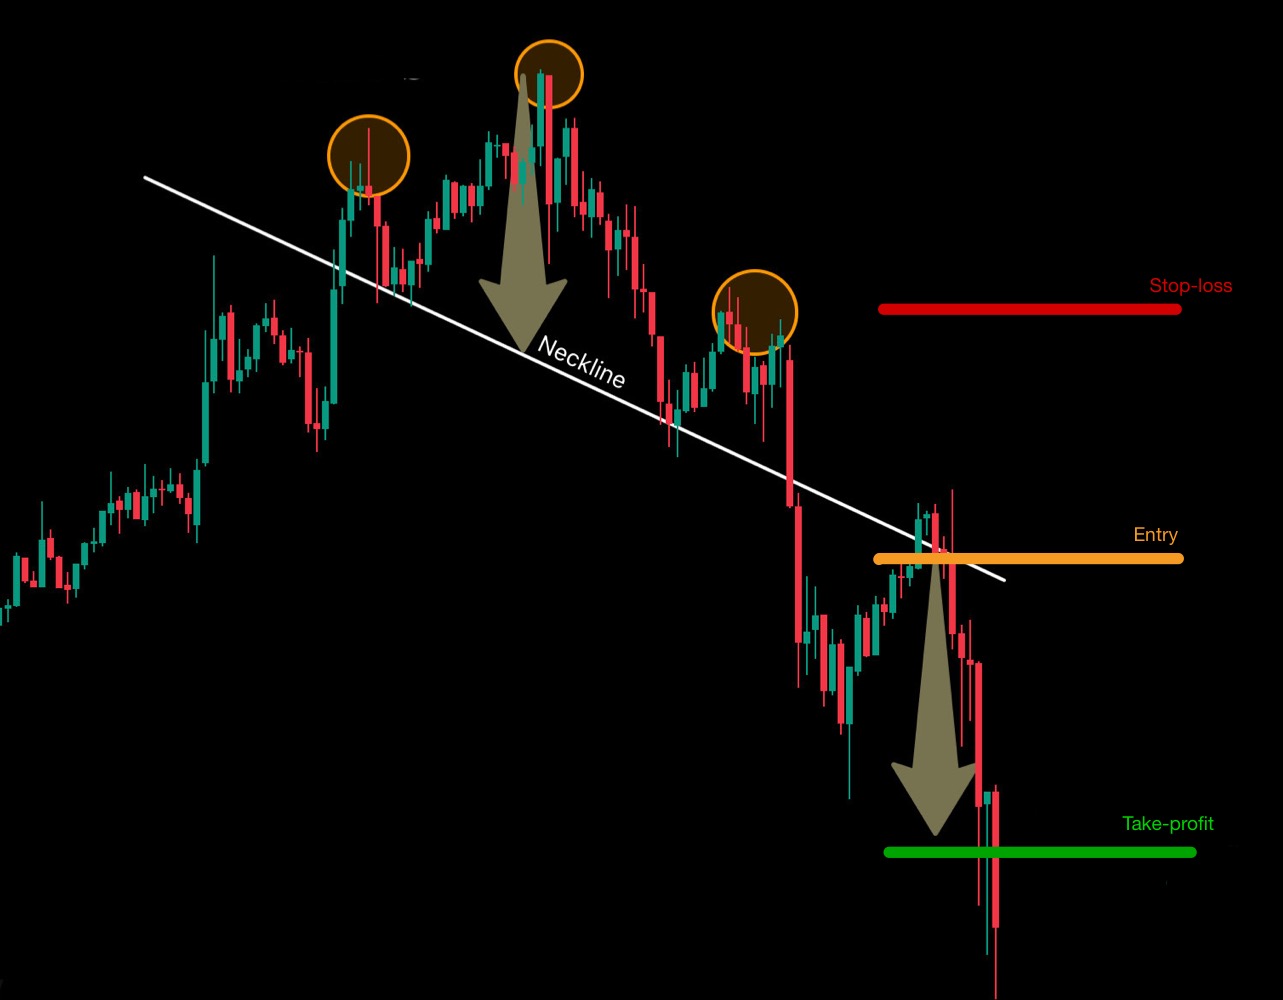
Another mistake is expecting perfect pattern formations. In reality, it’s okay if the neckline is flat, downward sloping, or even slightly upward sloping (in a standard pattern formation), and the shoulders are not always perfectly symmetrical.
Traders may also incorrectly try to find the pattern in non-reversal situations, like in the middle of a ranging market or when the price is still in an upward trend.
Finally, where you place your stop-loss plays an important role, too. A stop-loss that is too tight might not allow enough room for natural price fluctuations.
Real Chart Examples
Take, for example, the chart below.
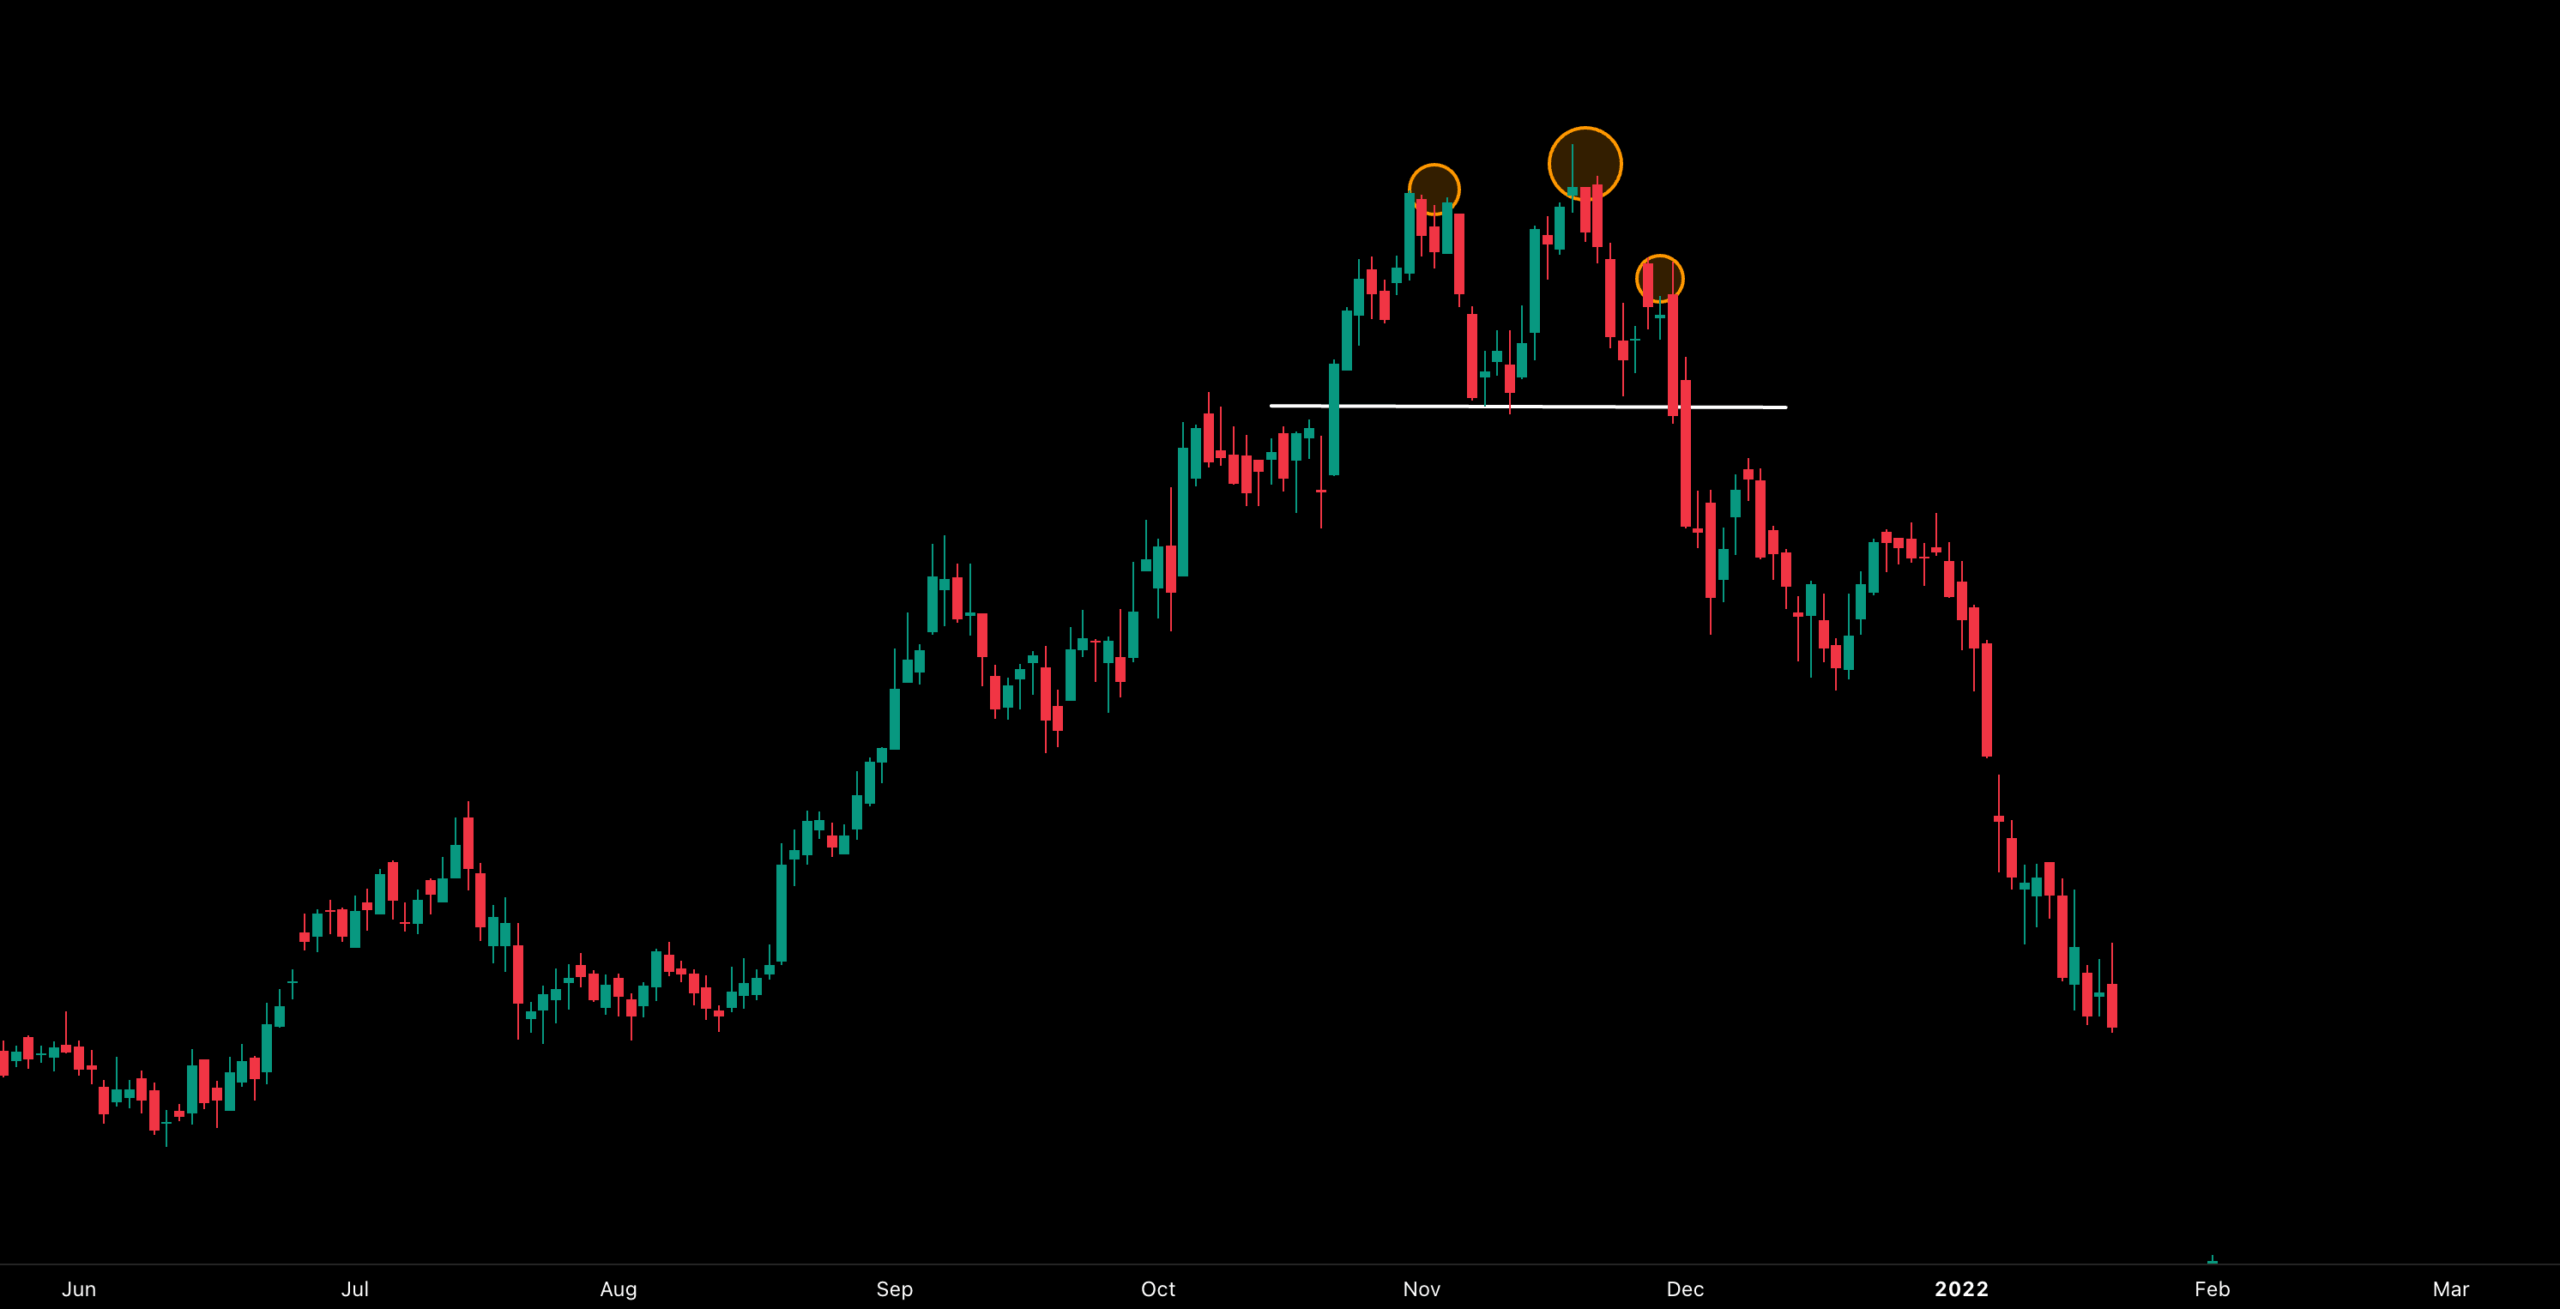
This is the price action of Netflix stock from June 2021 to February 2022, in the daily timeframe. As we can see, the price is in an uptrend until November 2021, when it begins to form an H&S pattern. We can clearly identify the left shoulder, the head, and the right shoulder. The price then breaks the flat neckline and starts its descent, which continues in the following months.
Here is another great example. An inverse H&S.
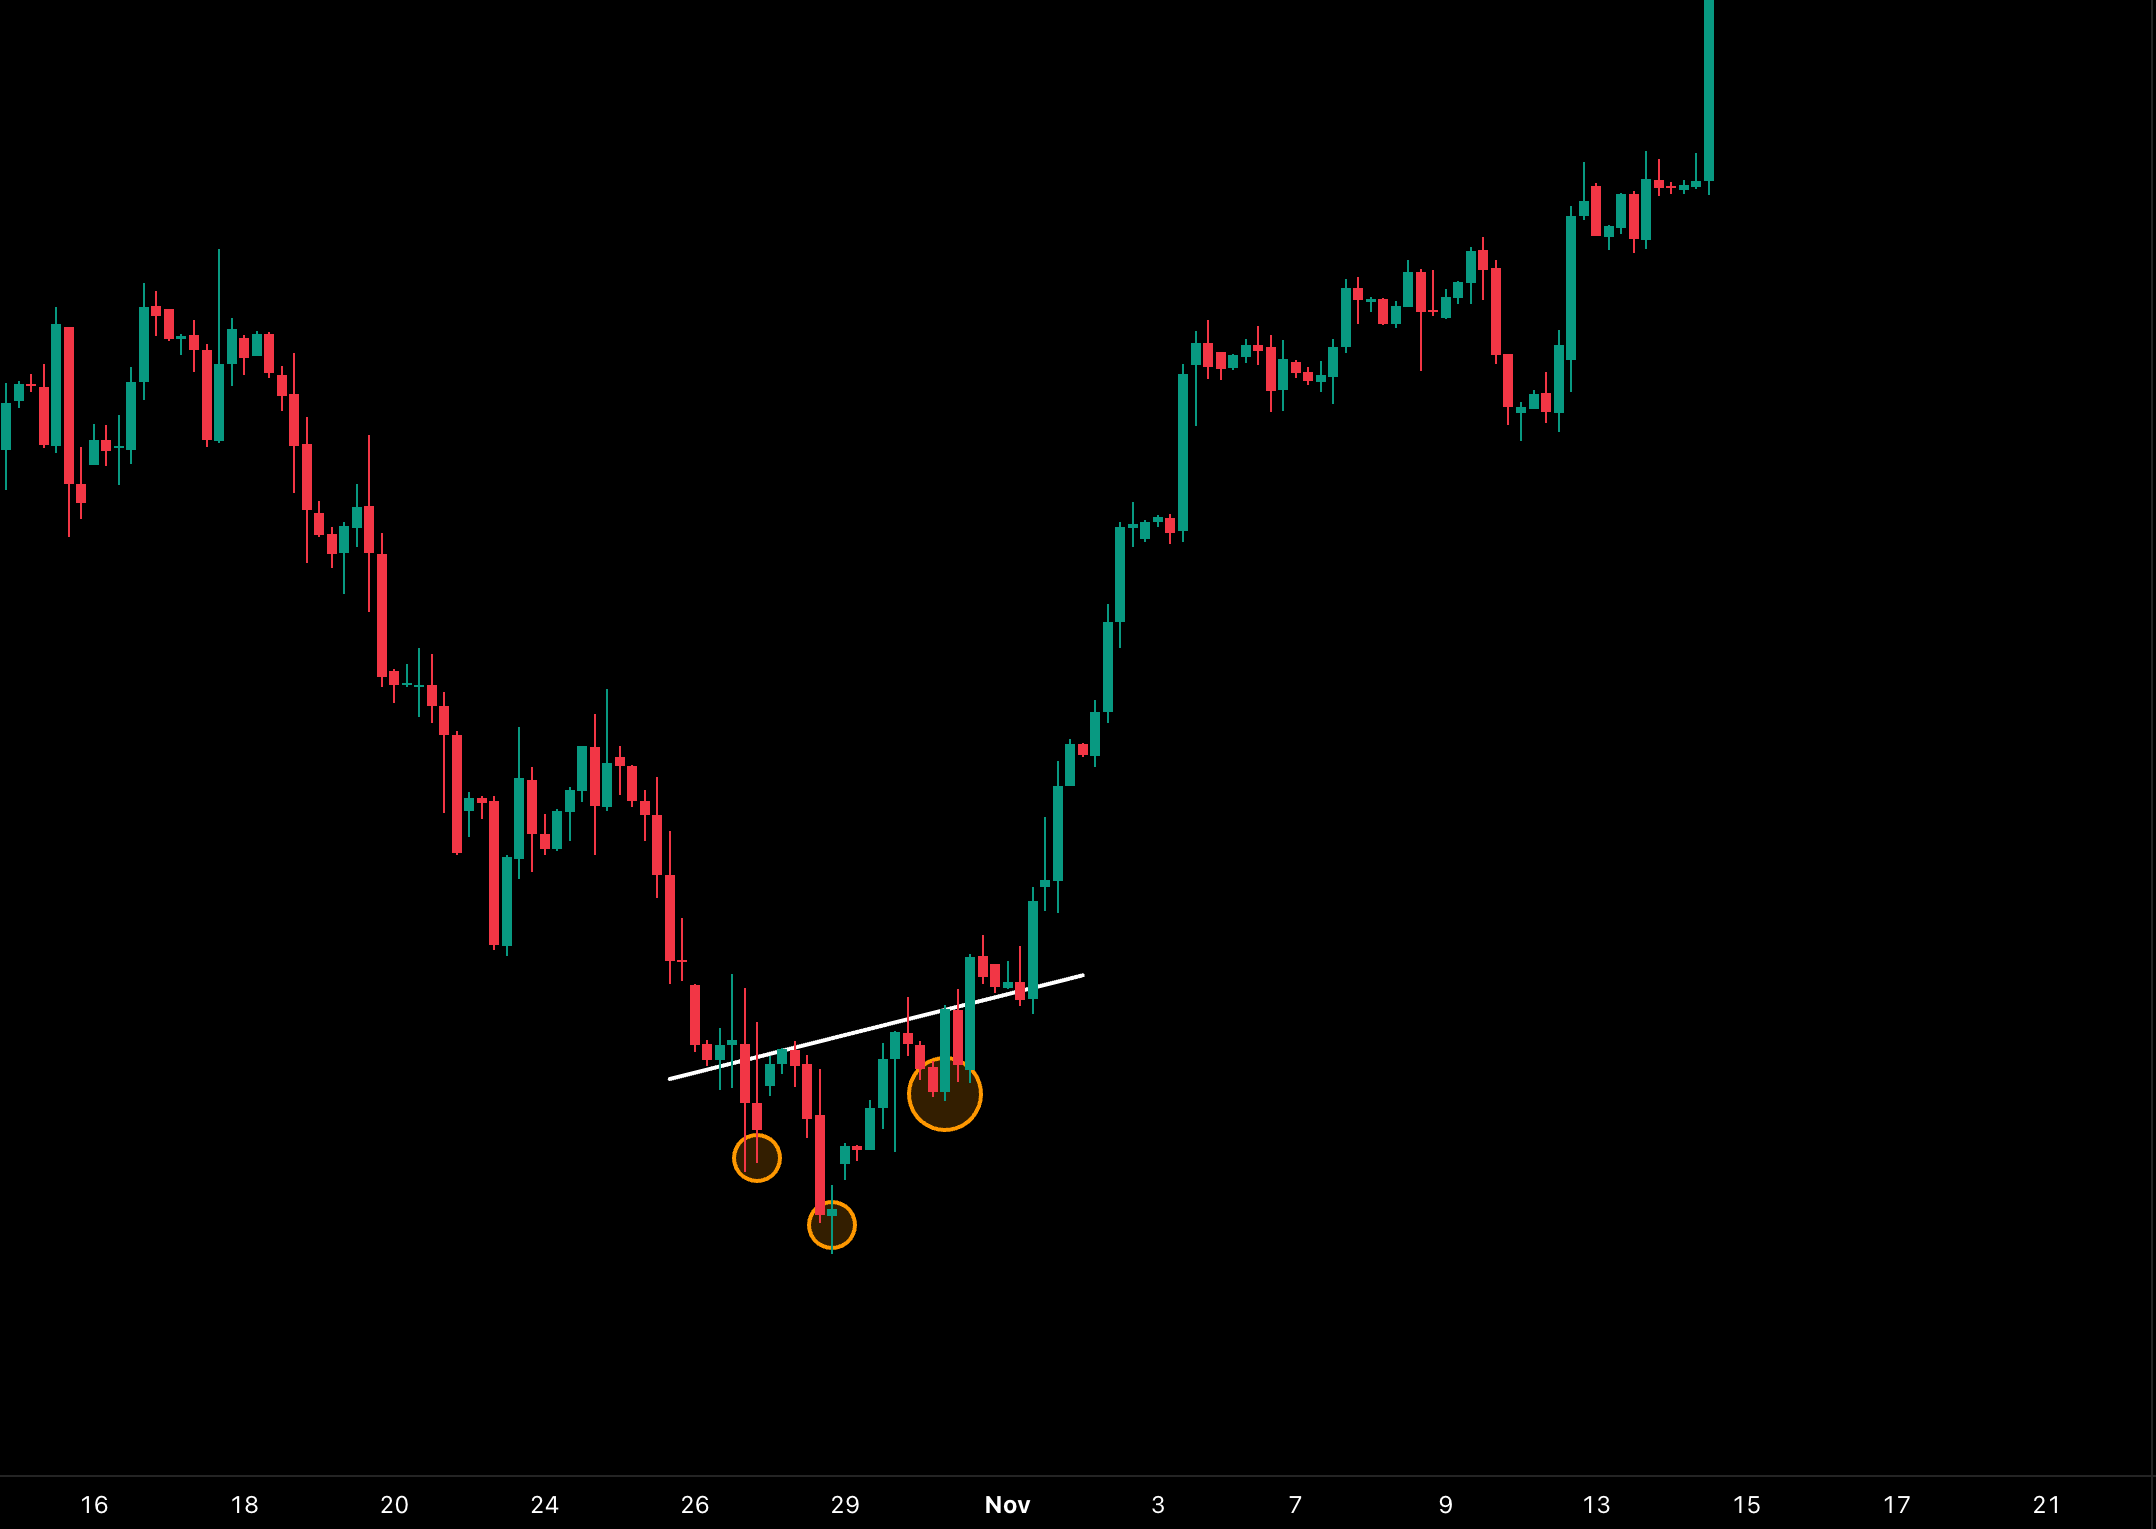
This is the price action of the US500 index, from October 16 to November 15, shown on the four-hour timeframe. The neckline is slightly upward sloping. The price breaks it, retests it, and then explodes up.
Finally, this example highlights the importance of waiting for the right moment.
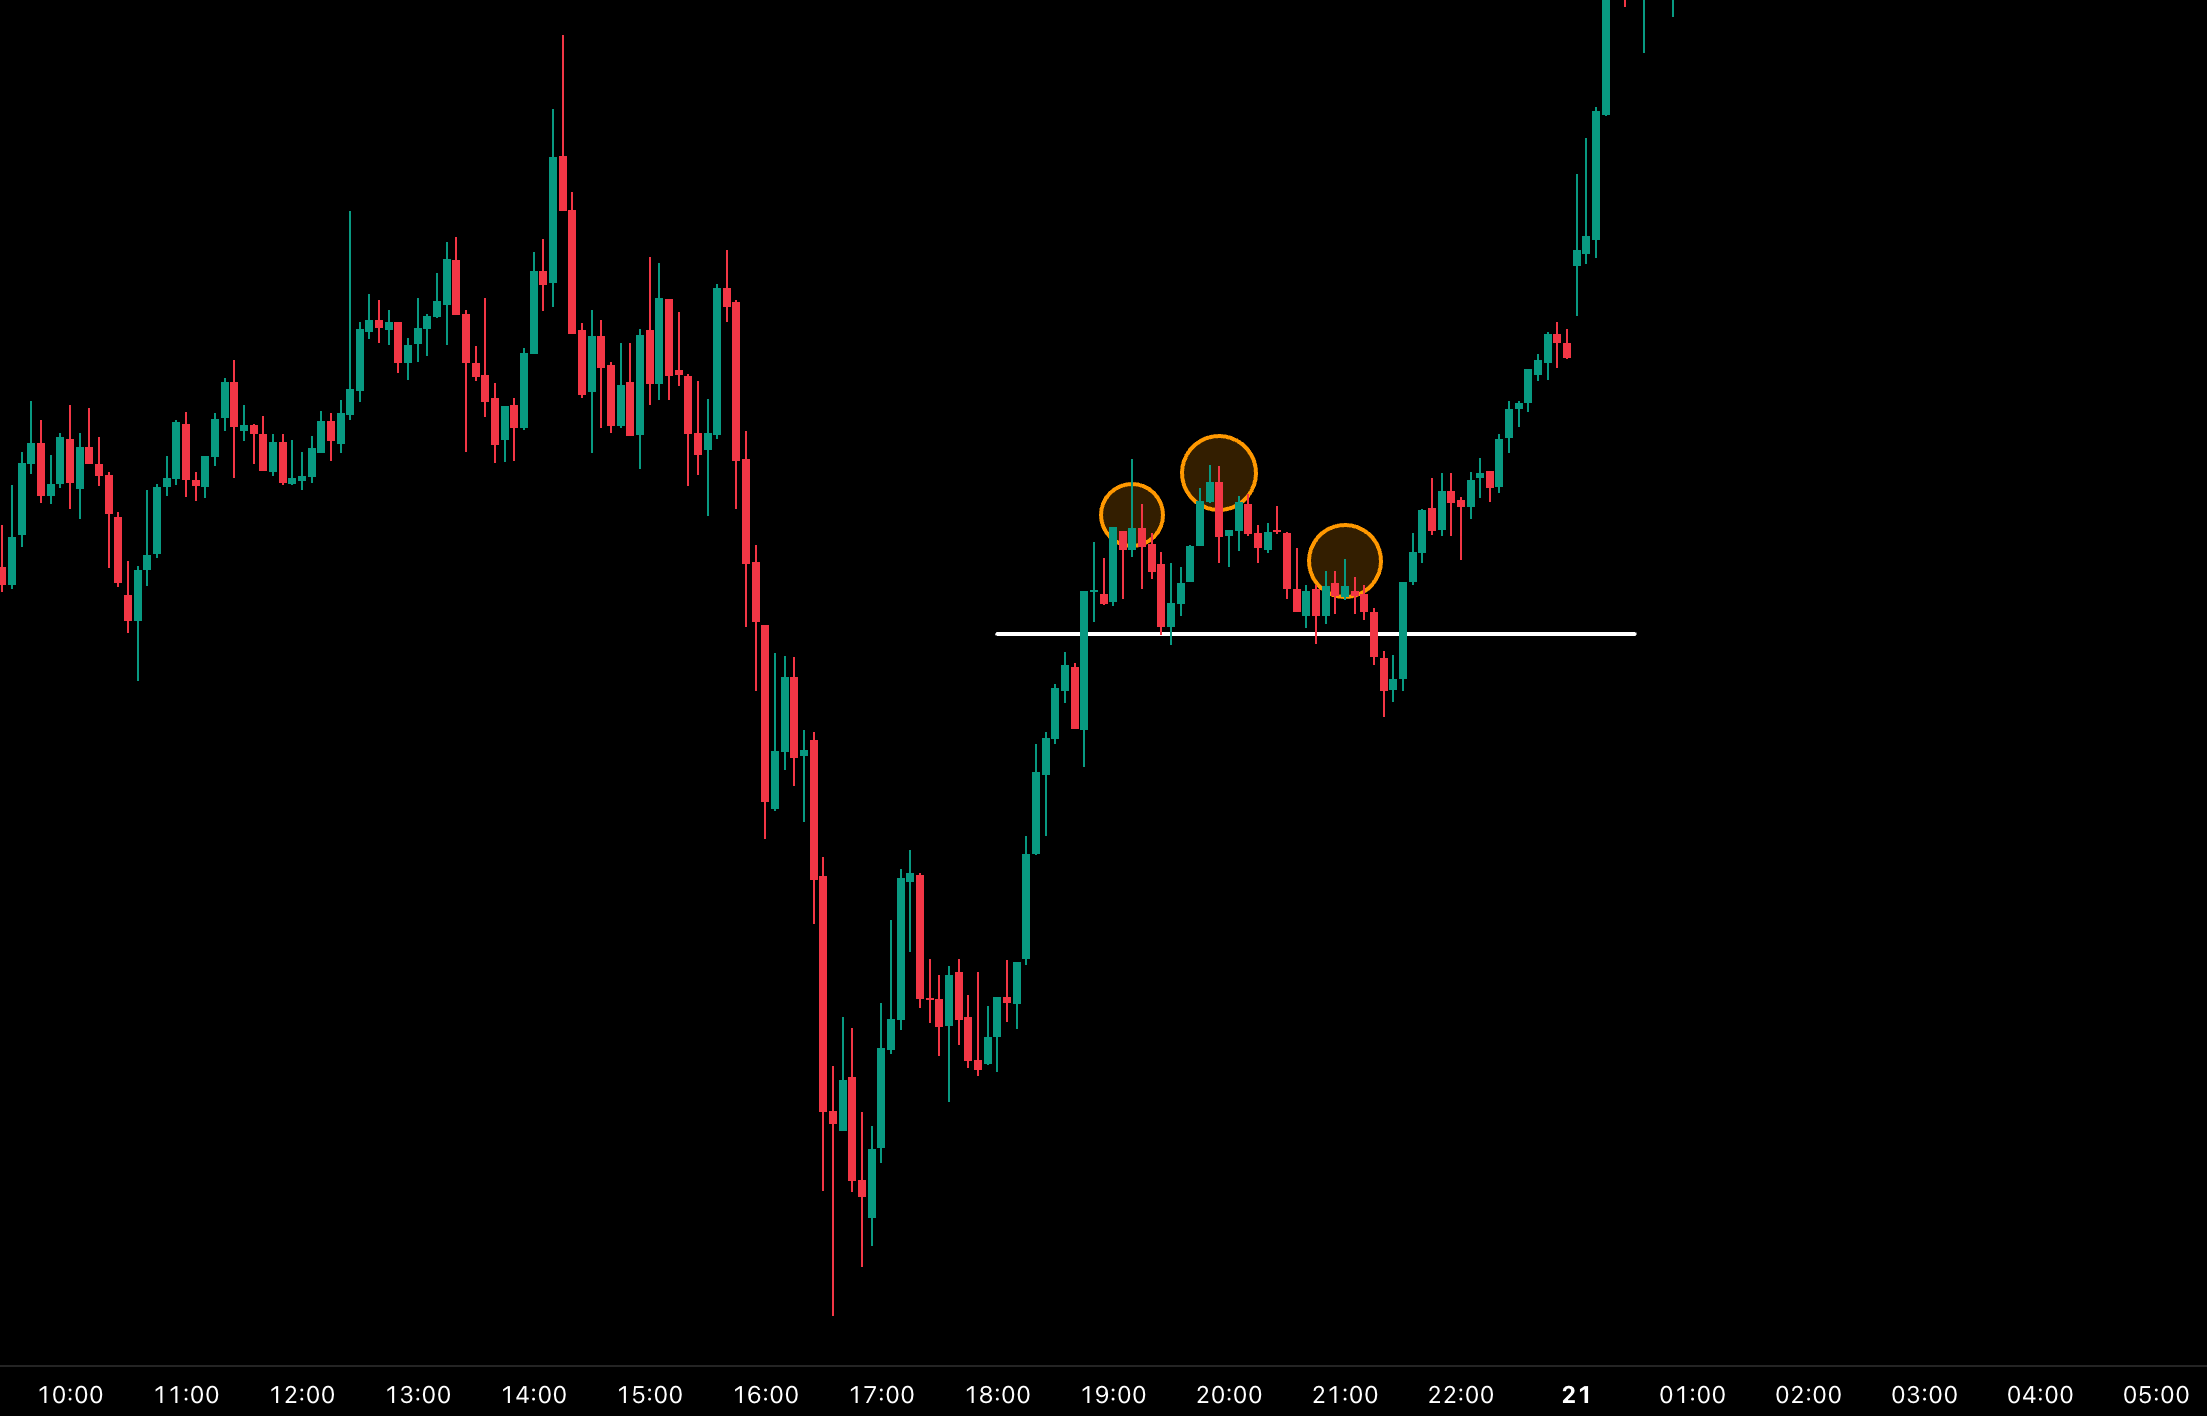
This is Gold in the 5-minute timeframe, from 10:00 on April 17, 2025, to 01:00 on April 21, 2025. The price begins to rise after a downtrend and forms a Head and Shoulders pattern. It even breaks the neckline, but then keeps going up. Entering this trade would have resulted in a loss. Why? The uptrend wasn’t mature enough. Buyers weren’t done yet.
Conclusion
The Head and Shoulders pattern is one of the most powerful tools for spotting trading opportunities. It works across all timeframes, making it suitable for every trading style, from swing trading to scalping.
While it’s not difficult to identify, it does require a trained eye and a bit of experience.
Mistakes are part of the learning process. The key is to learn and approach the next trade with greater confidence.
Reference List:
What Is a Head and Shoulders Chart Pattern in Technical Analysis?
How to Trade the Head and Shoulders PatternComprehensive guide on the head and shoulders chart pattern for traders