Diving into the context of investing can sometimes feel like venturing into unfamiliar territory. You’ll find a lot of information, approaches, and tools to discover. Technical analysis is one of these tools that has long been at the core of trading. In fact, it’s an approach that helps make sense of historical price and volume data in order to project future market movements.
Let’s simplify the process of technical analysis and explore its complexity. After reading this post, you will possess the knowledge to successfully get around the financial markets. Thus, it’s time to start exploring the possibilities that this strategy holds.

Technical Analysis: Definition
What exactly is technical analysis? It’s simply a strategy for predicting potential price shifts by studying historical price and volume data. The basic assumption is that previous price and volume patterns tend to repeat themselves. So, this strategy allows traders to identify potential patterns and reversed movements.
Technical Analysis: The Core Components
Price Charts
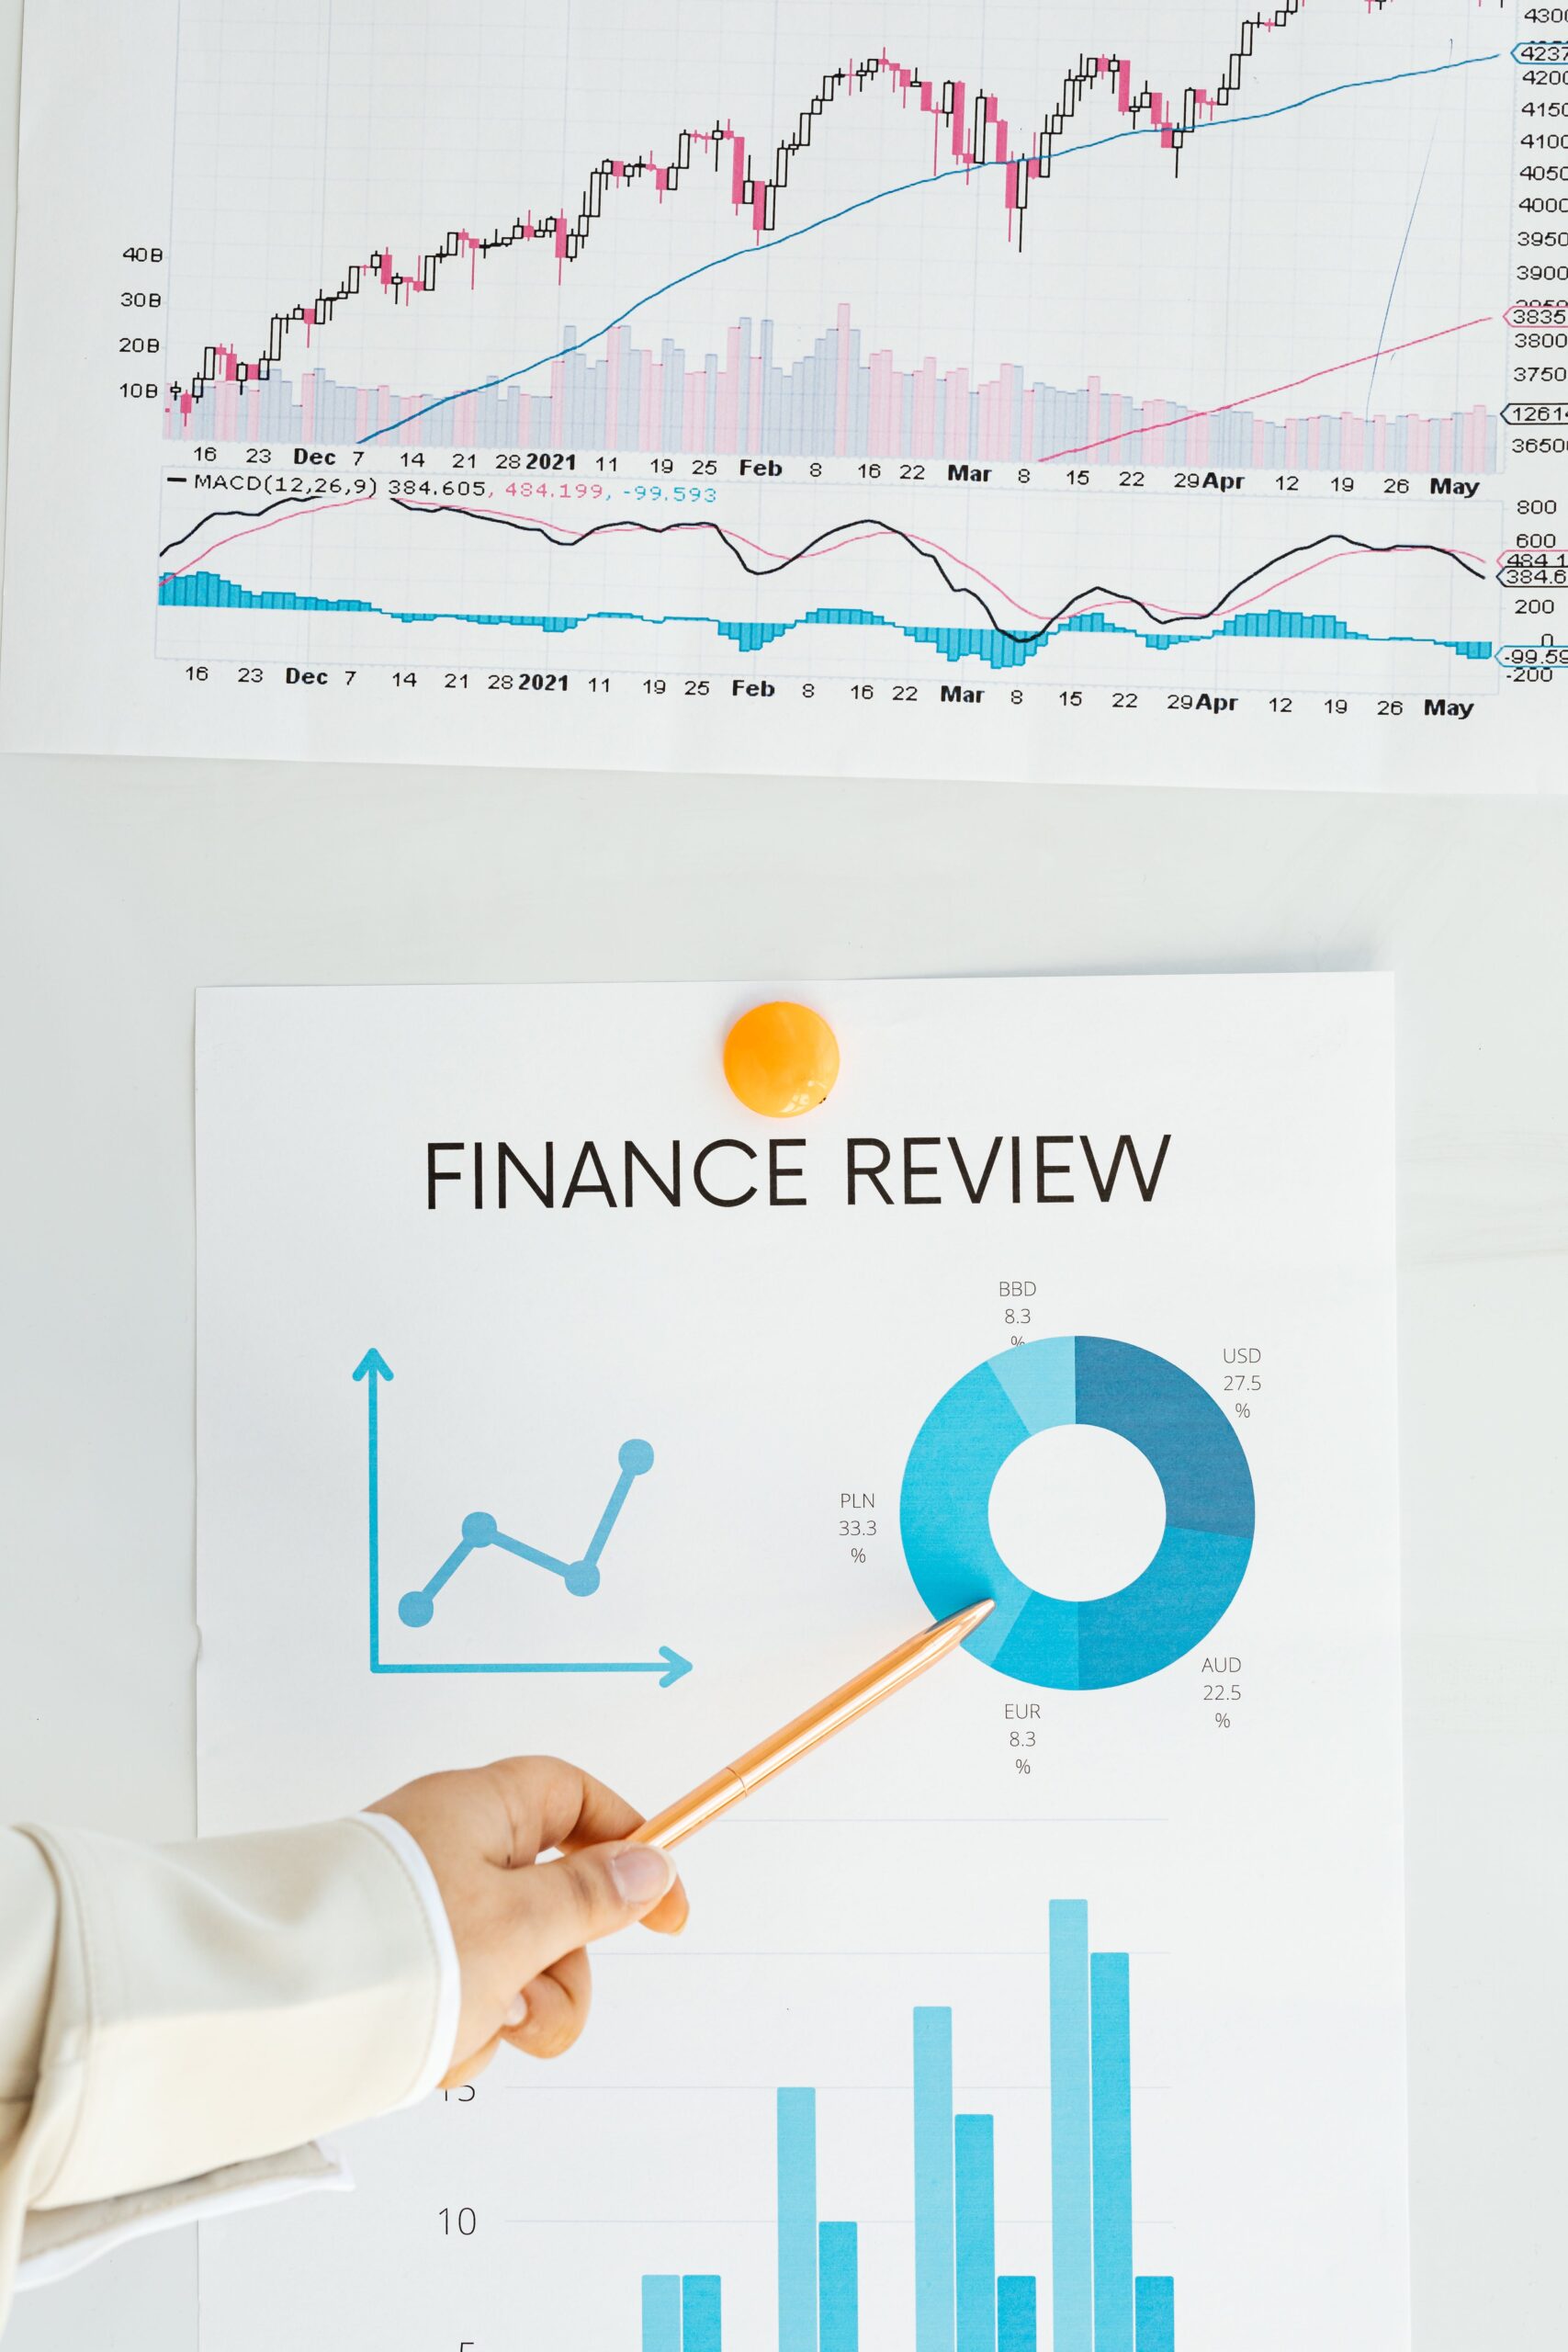
Price charts are visual representations, similar to historical maps used by traders as they explore the market environment. Line charts, bar charts, and candlestick charts are examples of graphic formats that convey information about price changes over time.
Indicators
Consider indicators to be your compass that guides you through the market’s landscape. Moving averages, the Relative Strength Index (RSI), and the Moving Average Convergence Divergence (MACD) are among them. Each provides further insights into market patterns and ideal entry or exit points.
Support and Resistance
These are the checkpoints in your trading adventure. Support serves as a fortress where demand stays firm against price drops. On the other hand, resistance acts as a battleground where selling pressure may cause a market reversal.
Trends
Consider trends to be the market’s pulse. This is because trendlines indicate whether the market is moving upward, downward, or sideways.
Patterns
Think of patterns as cryptic clues in the stock market’s confidential language. Recognizing patterns like head and shoulders, double tops, and flags corresponds to decoding hints about potential alterations or an extension in the market’s plot.

Technical Analysis: The Pros
Timing
This approach allows you to discover the best timing to enter or exit the market. As a result, it significantly lower the chances of making poor decisions.
Risk Control
It provides you with the means of building defenses. In other words, it allows you to save your money by determining stop-loss orders and balancing potential rewards against risks.
Technical Analysis is Data-Driven
Since this strategy is based on facts, it provides a more objective approach towards navigating the market’s intricate labyrinth.
Adaptability
The strategy has proven successful in assessing the trading of stocks, cryptocurrencies, currency, and commodities.
Perfect for Day Trading
For individuals who enjoy immediate action, the strategy can help you make sense of daily market fluctuations.
Technical Analysis: The Cons
Limitations
Some critics believe that the process of assessing historical data is excessively focused on the past and may miss unforeseen market developments.
Subjectivity
Different analysts may interpret charts and indicators in their own unique way, incorporating some degree of human bias.
Long-Term Doubts
A few critics claim that fundamental analysis is a superior compass for navigating the market, in terms of long-term investments.
Technical Analysis is Your Key to Success
Technical analysis corresponds to a sophisticated tool for traders and investors, paving the way for informed investment choices. While it isn’t without limitations and has its critics, its data-driven and unbiased integrity creates a solid foundation for trading. Regardless of the level of experience in investing, incorporating this strategy into your trading strategies can impact your success significantly. Therefore, acknowledge its potential and witness your trading abilities ascend to novel peaks!
Reference list:
Technical Analysis: What It Is and How to Use It in Investing
What is Technical Analysis (TA)? | Definition & Trading Examples
What is Technical Analysis? Definition, Types of Charts
Author: Alex Nguyen